10 Professional Services KPIs Every Firm Should Track
Discover 10 professional services KPIs that help firms improve utilization, profitability, delivery performance, and resource planning.
You probably know this situation.
A new project comes in, the client is excited, and the team is ready to start. Then you check your resource plan and realize the person with the exact experience you need is already booked.
Now the questions begin: Can someone else take it? Do you move the timeline? Which project gets priority?
These decisions happen every week in professional services firms. The challenge is that many problems show up before they appear in financial reports: overloaded specialists, shifting priorities, and projects slowly losing margin.
The right KPIs help you spot these signals earlier. In this article, we’ll look at 10 professional services KPIs that reveal the health of your delivery, from utilization and capacity to project profitability and client success.
Why Professional Services KPIs Need a Different Approach
Professional services firms differ from many other businesses in a major way: their biggest asset walks out the door every day.
Your team’s time, skills, and experience are what you sell. That means performance depends not only on how much work you win, but also on whether you have the right people available to deliver it.
This makes measurement a little tricky. Revenue can tell you how much work is coming in, but not whether your team has enough capacity to handle it. Utilization can show that people are busy, but not whether they are working on the right projects. A healthy project margin can still hide problems that started with unrealistic estimates or resource constraints.
For example, a consulting firm may have a full pipeline but only a few people with the expertise needed for upcoming projects. Another team may look highly utilized while quietly burning time on rework and unexpected requests.
The most useful professional services KPIs help leaders connect these signals across four areas:
- Demand: Do we have enough work, and can we take on more?
- Capacity: Do we have the right people available when we need them?
- Delivery: Are projects moving in the right direction?
- Profitability: Are we creating enough value from the work we deliver?
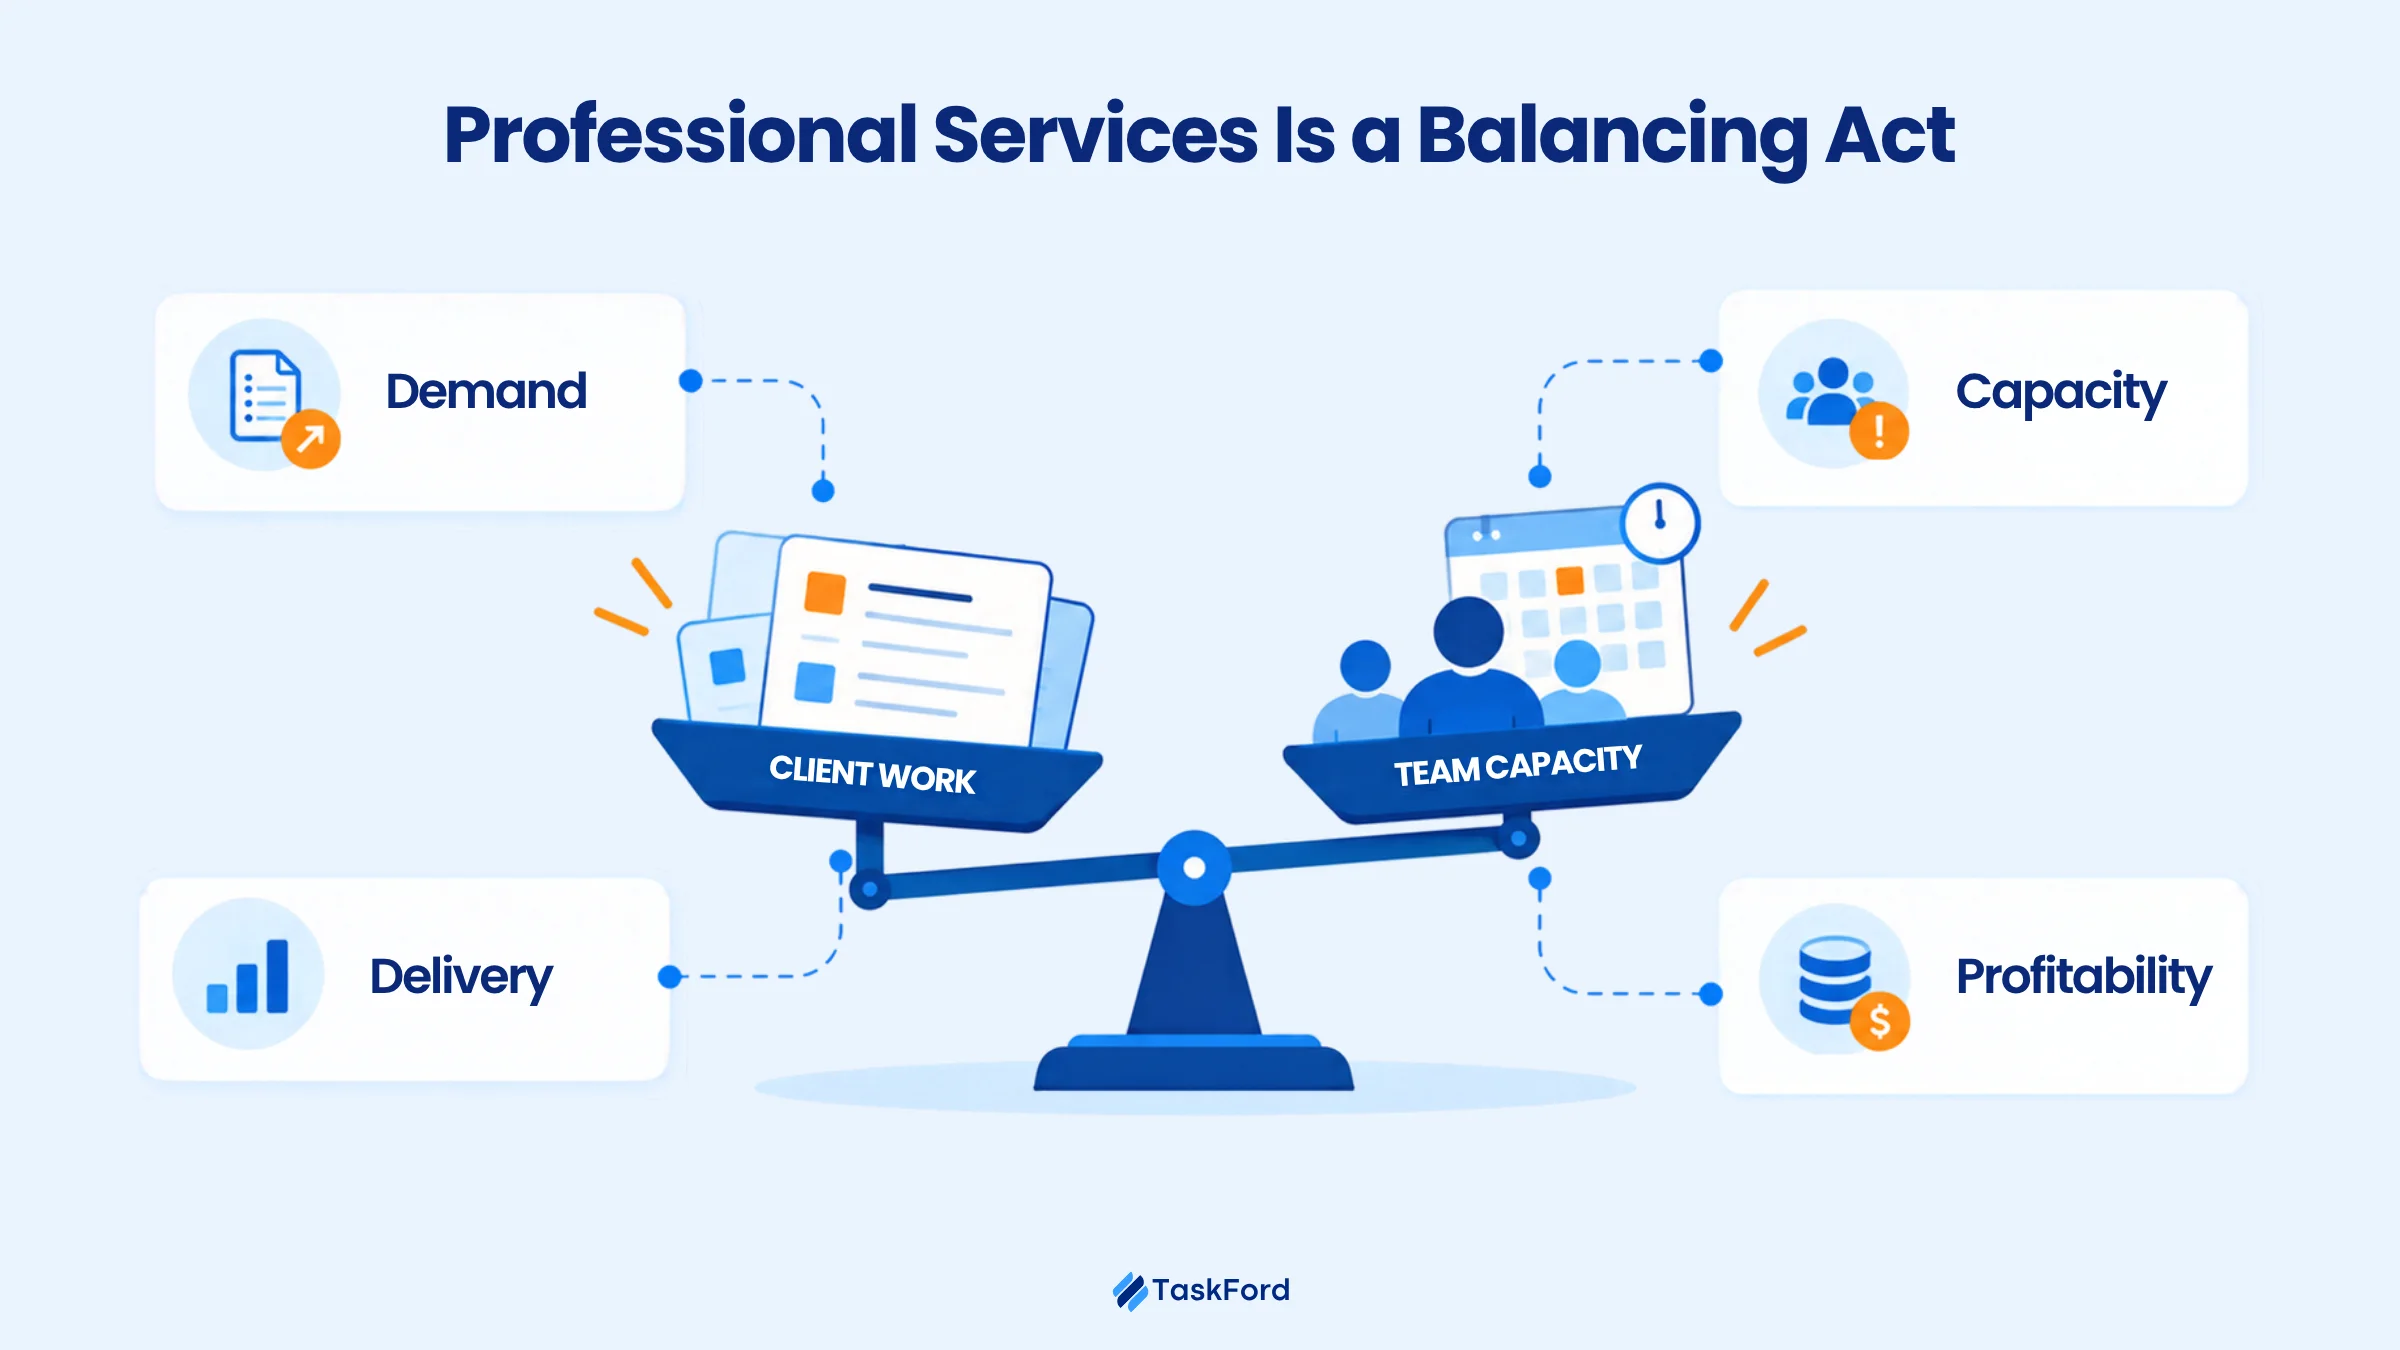
When these areas are viewed together, KPIs become more than numbers in a monthly report. They help leaders make better decisions about staffing, project commitments, and future growth.
10 Professional Services KPIs Every Firm Should Track
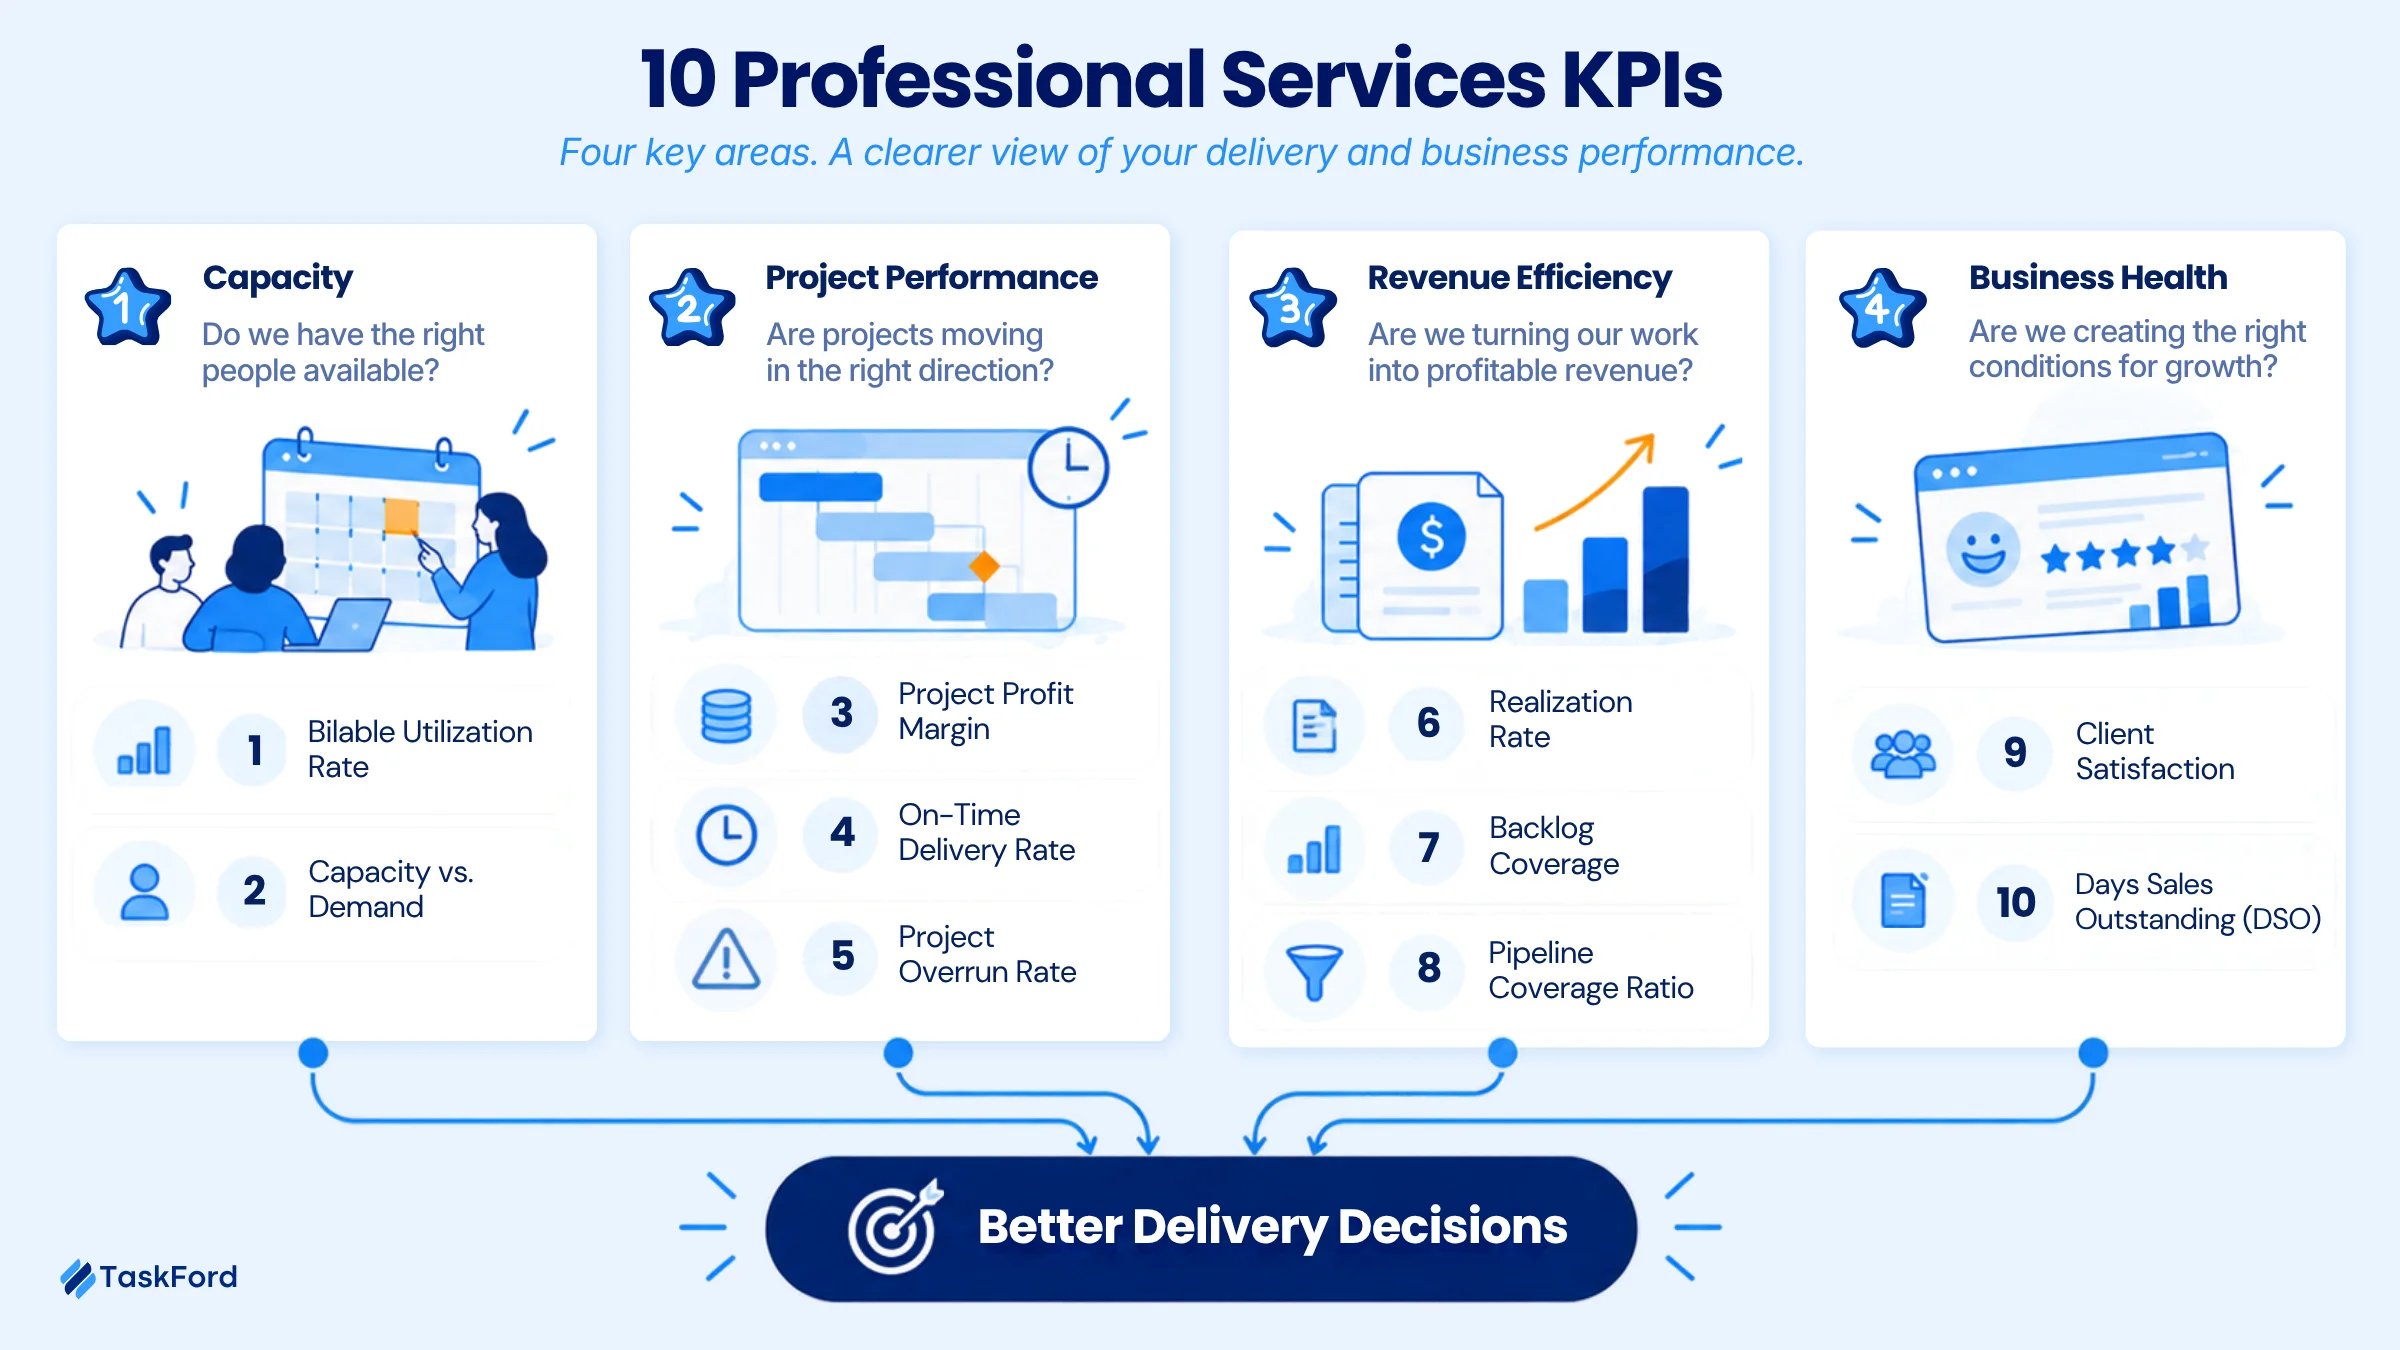
The most useful professional services KPIs connect day-to-day delivery with business performance. The metrics below cover four areas that matter most: capacity, project performance, revenue efficiency, and business health.
1. Billable Utilization Rate
What it tells you: How much of your team’s available time is spent on billable client work.
For professional services firms, time is the product. A consultant sitting idle means missed revenue opportunities, while a consultant spending too much time on billable work can quickly become overloaded.
Billable utilization helps you understand whether your team’s capacity is being used effectively. It is commonly calculated as:
Billable Utilization = Billable Hours ÷ Available Working Hours × 100
For example, if a consultant has 160 available hours in a month and spends 120 hours on client work, their utilization rate is 75%.
However, utilization should not be viewed as a simple “higher is always better” metric. A team operating at extremely high utilization may have little room for project planning, internal improvements, training, or unexpected client requests.
A useful utilization target depends on the role, service model, and business goals. The more important question is whether your utilization level supports sustainable delivery while keeping projects profitable.
2. Capacity vs. Demand
What it tells you: Whether your available capacity can support current and upcoming work.
Capacity vs. demand compares the time your team can realistically spend on delivery with the workload required by current and future projects.
Capacity vs. Demand = Available Capacity ÷ Forecasted Demand × 100
Available capacity should account for planned time off, meetings, internal work, and other non-billable time. Forecasted demand should reflect the expected effort for committed projects and realistic upcoming work.
A result below 100% means forecasted demand exceeds available capacity, signaling a potential resource gap. A result above 100% means you have more capacity than planned demand.
For example, a consulting firm may have enough people overall but still face a capacity gap because several projects require the same senior specialist. The problem is not headcount. It is having the right skills available at the right time.
Tracking this KPI helps leaders identify resource gaps earlier and make better decisions about staffing, project timelines, and taking on new work.
3. Project Profit Margin
What it tells you: How much money a project makes after the costs of delivering it.
A project can bring in plenty of revenue and still make less profit than expected. Project profit margin helps you see how much is left after paying for the people, contractors, and other direct costs needed to complete the work.
Project Profit Margin = (Project Revenue − Direct Project Costs) ÷ Project Revenue × 100
For example, if a project brings in $100,000 and costs $65,000 to deliver, its profit margin is 35%.
A falling margin is worth investigating. The team may be spending more hours than planned, dealing with extra client requests, or using more expensive resources than expected.
Tracking project margin helps you see whether projects are delivering the financial results you planned for, and where delivery may need to change.
4. Realization Rate
What it tells you: How much of your billable work actually turns into billed revenue.
You may have plenty of billable hours on the books, but that does not mean you are getting paid for all of them. Some hours may be discounted, written off, or included in fixed-fee work without generating the revenue you expected.
Realization Rate = Billed Revenue ÷ Potential Billable Revenue × 100
For example, if 100 billable hours could generate $15,000 at your standard rates but you only bill $13,500, your realization rate is 90%.
A low realization rate can point to issues such as excessive discounts, unbilled work, scope creep, or project overruns. Tracking it alongside utilization and project margin helps you see whether your team’s billable effort is actually translating into revenue.
5. On-Time Delivery Rate
What it tells you: How often your projects finish by the promised deadline.
On-time delivery rate shows the percentage of projects your team completes on schedule. It is a straightforward way to see whether your delivery plans are keeping up with client commitments.
On-Time Delivery Rate = Projects Delivered On Time ÷ Total Projects Delivered × 100
For example, if you complete 18 out of 20 projects on time, your on-time delivery rate is 90%.
A low rate may point to unrealistic timelines, resource shortages, scope changes, or dependencies that were missed during planning. Tracking it helps you spot patterns and improve future project planning.
6. Project Overrun Rate
What it tells you: How often projects go beyond their original budget, timeline, or planned effort.
Project overrun rate helps you see how often the actual cost or effort of delivery exceeds what was planned. It can reveal patterns in estimation, scope management, or resource planning that affect project profitability.
Project Overrun Rate = Projects With Overruns ÷ Total Projects × 100
For example, if 4 out of 20 projects exceed their planned budget or effort, your project overrun rate is 20%.
A high overrun rate may mean estimates are too optimistic, project scope is changing frequently, or teams are spending more time than expected. Tracking it can help you improve estimates and catch recurring delivery problems earlier.
7. Backlog Coverage
What it tells you: How much confirmed work you have compared with the revenue you expect to generate.
Backlog represents work that has already been sold but has not yet been delivered. Backlog coverage helps you understand how much future work is secured and whether your current commitments can support upcoming revenue targets.
Backlog Coverage = Confirmed Backlog ÷ Revenue Target × 100
For example, if you have $1.2 million in contracted work and expect to generate $1 million in revenue over the next period, your backlog coverage is 120%.
A healthy backlog gives you more visibility into future workload. Too little may leave your team dependent on new sales, while too much can put pressure on delivery capacity.
8. Pipeline Coverage Ratio
What it tells you: Whether your sales pipeline is large enough to support your future revenue goals.
Pipeline coverage compares the value of your qualified opportunities with your revenue target. It helps you see whether there is enough potential work coming in to replace completed projects and support growth.
Pipeline Coverage Ratio = Qualified Pipeline Value ÷ Revenue Target
For example, if your revenue target is $500,000 and your qualified pipeline is worth $1.5 million, your pipeline coverage ratio is 3×.
A low ratio may mean the firm needs more opportunities to support its target. A high ratio can provide more choice, but it does not guarantee that those opportunities will convert or that the team has capacity to deliver them.
9. Client Satisfaction
What it tells you: How satisfied clients are with your work and delivery experience.
Client satisfaction gives you feedback that project and financial metrics cannot. A project can finish on time and within budget while the client still feels that communication, quality, or support fell short.
You can measure it through surveys such as CSAT, which asks clients to rate their satisfaction with a specific service or engagement.
CSAT = Satisfied Responses ÷ Total Responses × 100
For example, if 45 out of 50 clients give a positive satisfaction rating, your CSAT is 90%.
Tracking client satisfaction helps you identify recurring issues in delivery and understand where the client experience could be improved. It can also provide an early signal when a project relationship needs attention.
10. Days Sales Outstanding (DSO)
What it tells you: How long it takes your firm to collect payment after invoicing clients.
Professional services firms often complete work before they receive payment. A firm can have profitable projects and strong revenue while still dealing with cash-flow pressure if invoices take too long to collect.
DSO = Accounts Receivable ÷ Credit Sales × Number of Days
For example, if your firm has $200,000 in outstanding receivables and $600,000 in credit sales over a 90-day period, your DSO is 30 days.
A rising DSO means money is taking longer to come in. Tracking it helps finance and operations teams spot collection problems and understand how quickly completed work turns into cash.
You do not need to review all 10 KPIs with the same level of attention every week. Instead, use them to spot where action is needed. A capacity gap may call for a staffing change, falling project margins may point to scope or delivery issues, and a weak backlog may signal the need for more sales activity. The real value comes from connecting the numbers to the decisions behind them.
What Your KPIs Are Telling You
One KPI rarely tells the whole story. The real insight often comes from looking at two or three numbers together. When they move in the same direction, they can help you spot what is going wrong and where to look first.
| If you see… | It could mean… | Look at… |
|---|---|---|
| High utilization + falling margins | Projects are taking more time than planned | Actual vs. planned hours, scope changes, write-offs |
| Strong backlog + low capacity | Your team may not have enough people to deliver upcoming work | Skills, workload, staffing |
| Low utilization + strong pipeline | Upcoming work is not yet reaching the right people | Resource allocation, project start dates |
| Late projects + more overruns | Your estimates or plans may be off | Scope, dependencies, planned effort |
| Good margins + lower client satisfaction | Projects may be profitable but the client experience is suffering | Quality, communication, feedback |
| Strong revenue + rising DSO | You are making sales, but taking longer to get paid | Invoices, payment delays |
For example, high utilization usually looks good. But if project margins are falling at the same time, your team may be spending more hours than planned or doing work that is not fully billed. Before pushing utilization higher, find out where that extra time is going.
You do not need to react to every change in a KPI. Look for patterns across the numbers. Bringing this data together with professional services automation software can make those patterns easier to spot and act on.
Conclusion
Good KPI tracking should make running a professional services firm easier, not turn your weekly meeting into a spreadsheet-reading exercise.
Start with the numbers that matter most to your business. Use them to understand whether you have enough capacity, whether projects are profitable, whether delivery is on track, and whether clients are getting the value they expect.
The real value comes when those numbers help you spot a problem early and decide what to do next. That is when KPIs become more than performance metrics. They become useful tools for making better delivery decisions.
Related Articles













![Professional Services Project Plan Template [Free Excel Download]](/marketing/blog/professional-services-project-plan-template-free-excel-download.webp)




Subscribe for Expert Tips
Unlock expert insights and stay ahead with TaskFord. Sign up now to receive valuable tips, strategies, and updates directly in your inbox.