Employee Capacity vs. Availability vs. Utilization vs. Throughput: What’s the Difference?
Understand the difference between employee capacity, availability, utilization, and throughput, including formulas, examples, common mistakes, and practical workforce-management applications.
Managers often track employee capacity, availability, utilization, and throughput. These terms are related, but they do not mean the same thing.
An employee can have a full schedule and still complete less work than expected. Another employee can work fewer hours and deliver more high-quality results. The difference comes down to how time, workload, and completed work are measured.
The relationship is simple:
Capacity → Availability → Utilization → Throughput
This article explains each metric, how to calculate it, and how to use it when planning and reviewing employee workloads.
Quick Comparison
Capacity, availability, utilization, and throughput all help managers understand how employee time turns into completed work.
What they have in common is simple: each metric looks at a different step in the same process.
| Metric | What it means | Easy example |
|---|---|---|
| Capacity | How much work an employee can handle | An employee can handle 40 hours of work per week |
| Availability | How much time the employee is free to work | After leave and holidays, 32 hours are available |
| Utilization | How much available time is used for productive work | The employee spends 24 of those 32 hours on productive tasks |
| Throughput | How much work is completed | The employee finishes 22 cases during the week |
To understand these differences more clearly, let’s look at each metric in detail, including its meaning, formula, and a simple employee example.
What Is Employee Capacity?
Employee capacity is the amount of work an employee or team can reasonably handle within a set period, such as a day, week, or month.
Each team member can have a different capacity. Their capacity depends on factors such as working hours, role, experience, task type, and current responsibilities. For example, a full-time employee may have 40 work hours per week, while a part-time employee may have 20. A senior employee may also be able to handle more complex work than a new team member.
Capacity can be measured in different ways depending on the role.
- For office employees, it may be measured in work hours, tasks, or projects.
- For customer support teams, it may be measured in tickets, calls, or customer requests.
- For operations teams, it may be measured in orders, applications, or other work items.
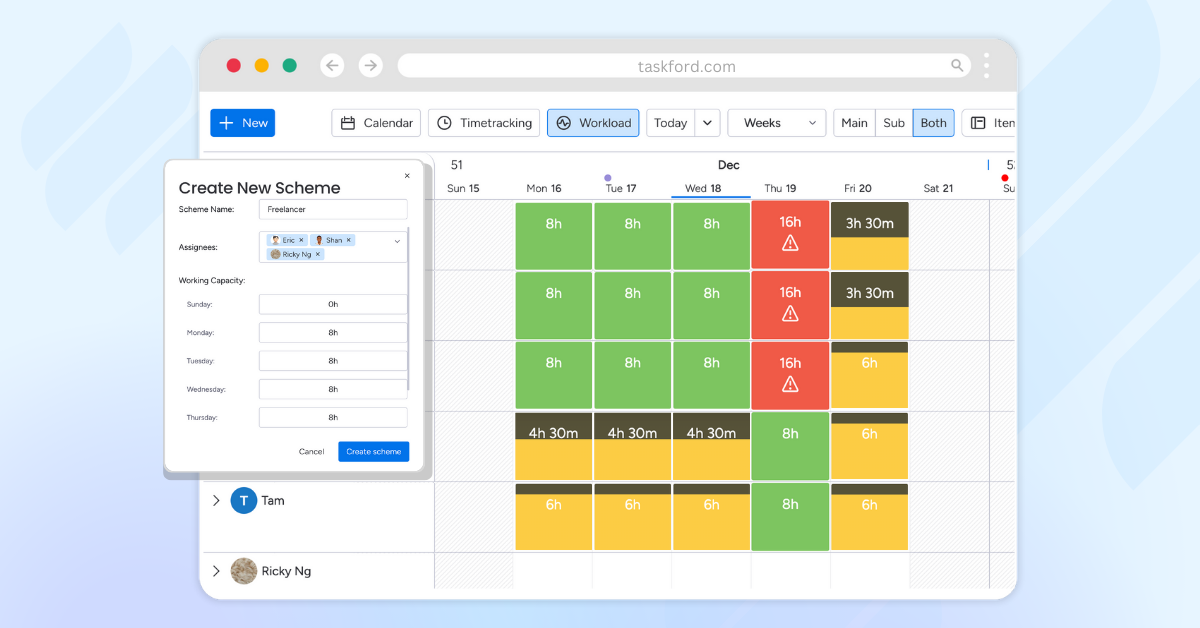
Managers can set a custom capacity for each employee based on their actual schedule and workload. For example:
The team’s total capacity is the sum of each member’s capacity:
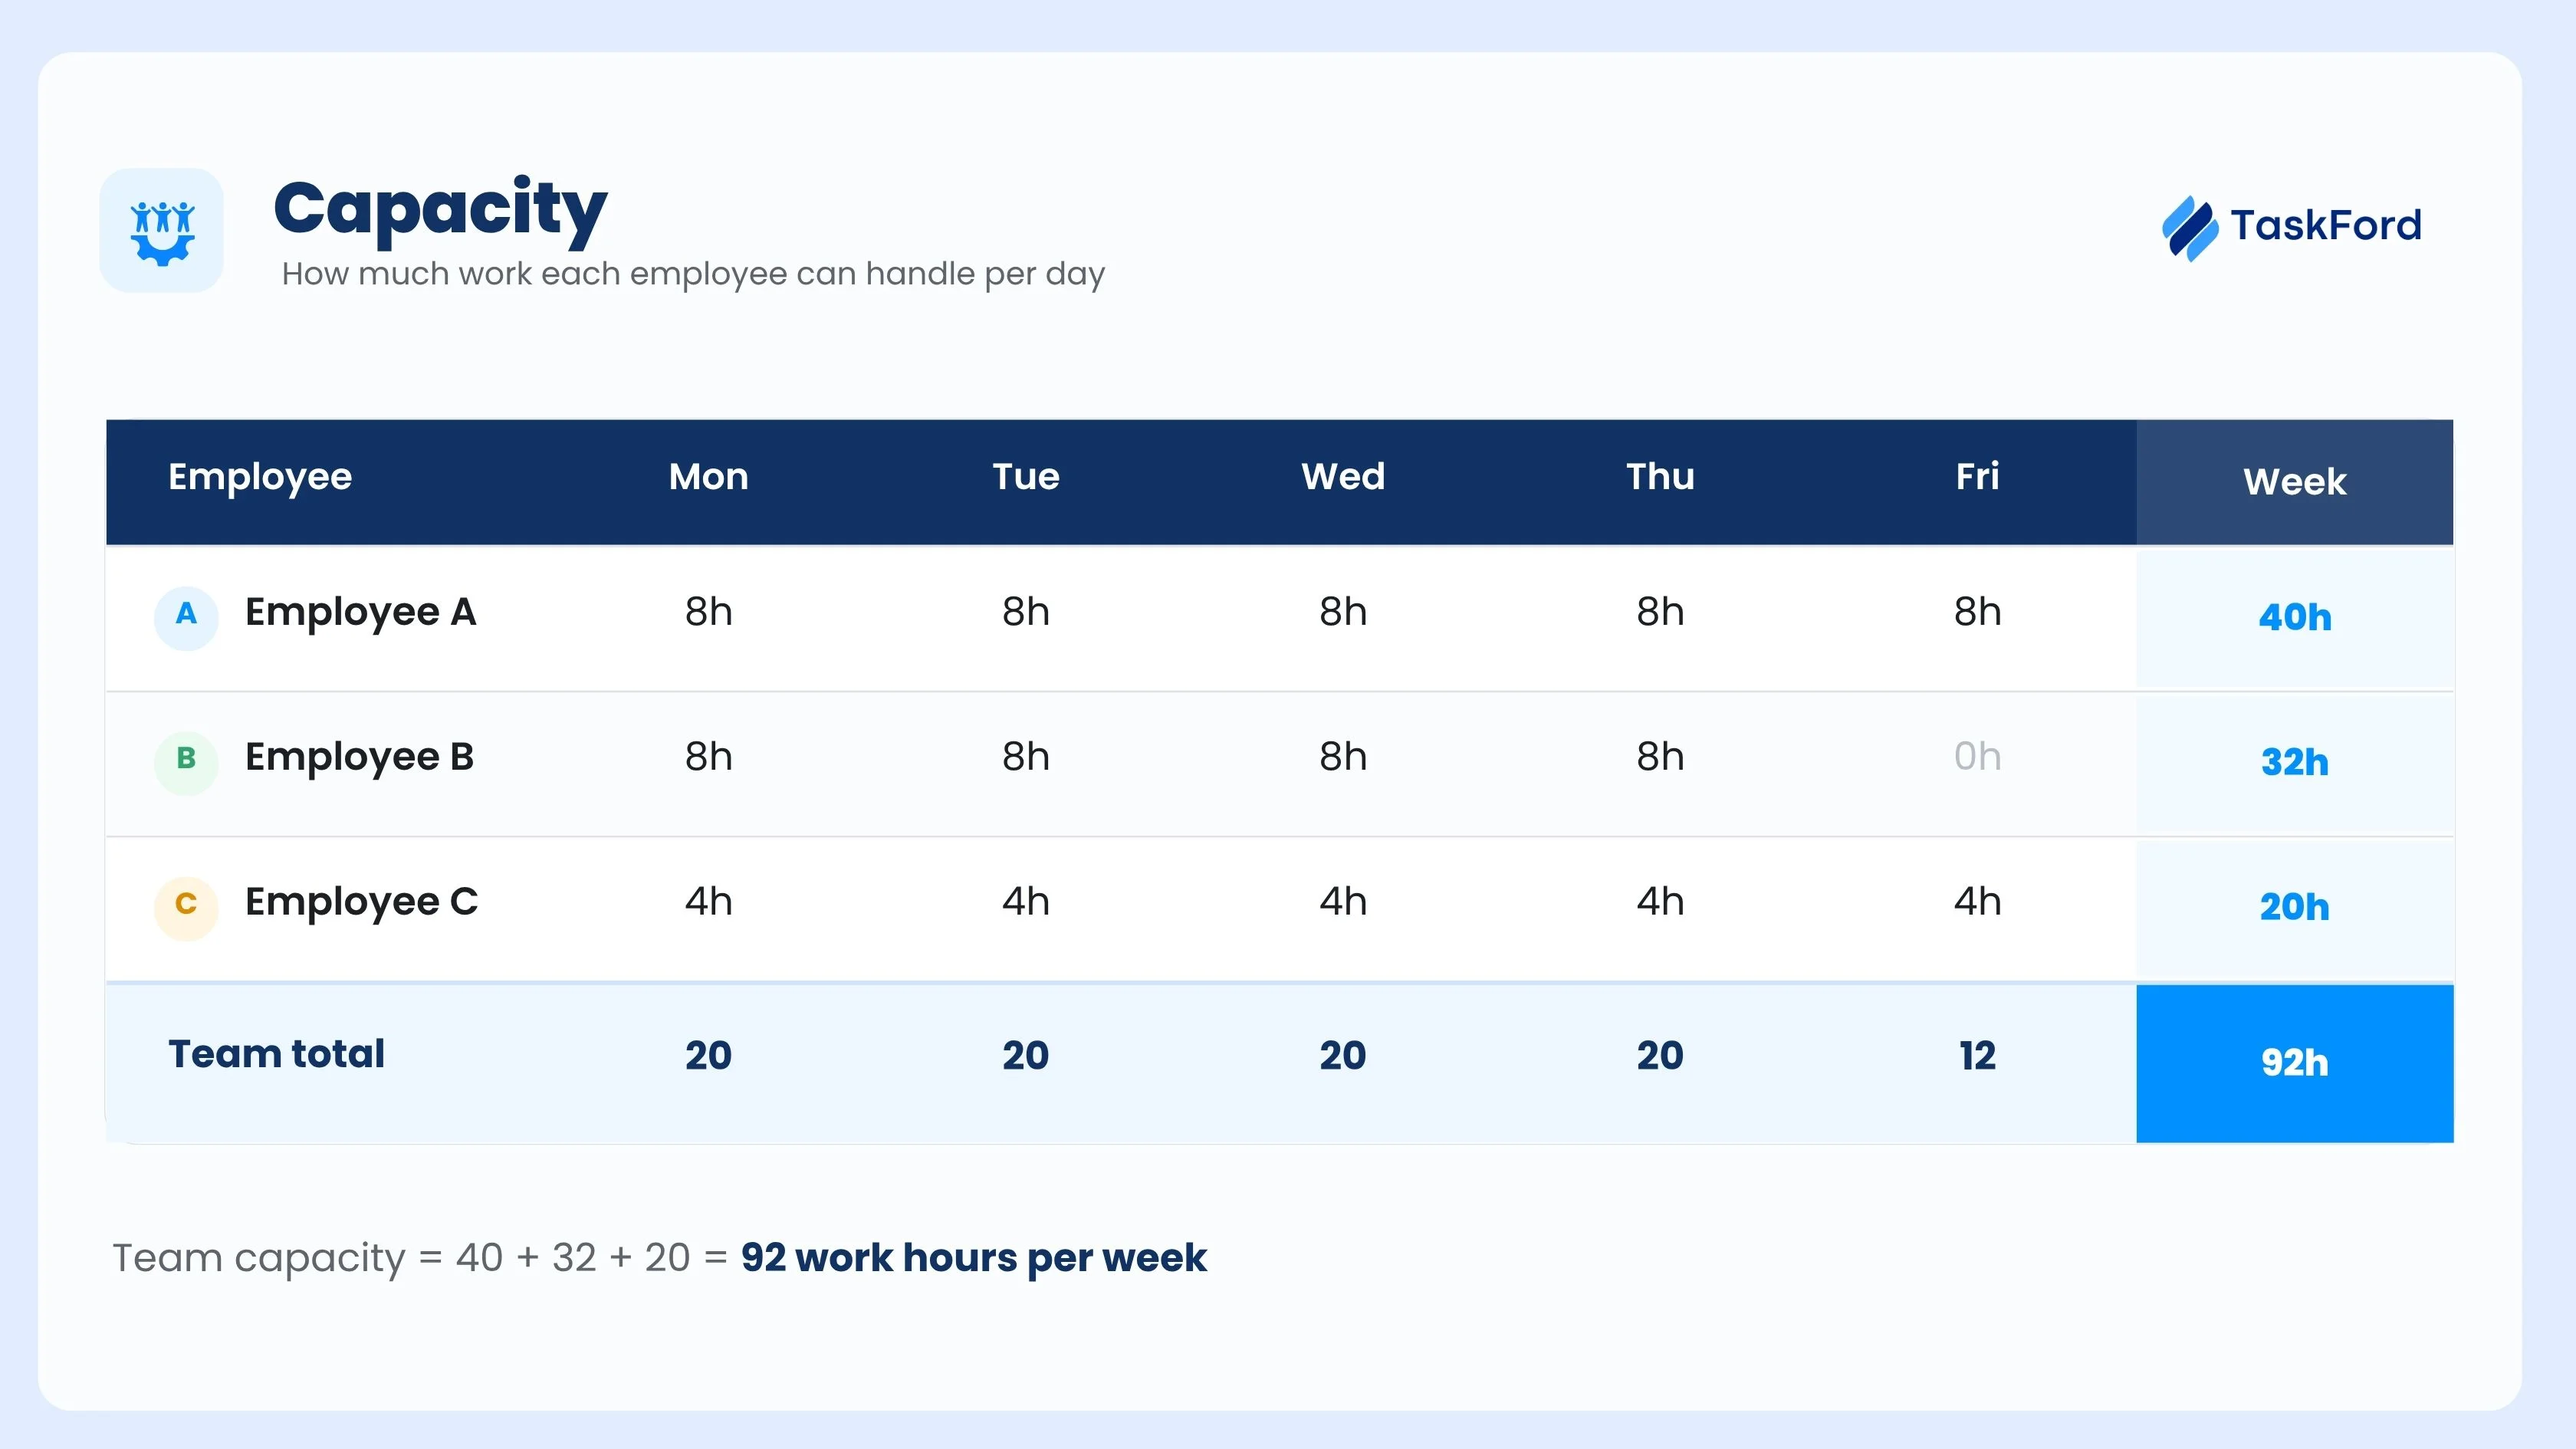
40 + 32 + 20 = 92 work hours per week
A simple formula is:
Team capacity = Total capacity of all team members
Or, when every employee has the same working hours:
Team capacity = Number of employees × Working hours
For a team of five employees working 40 hours each:
5 × 40 = 200 work hours per week
This number shows the team’s total scheduled time capacity. It does not mean that all 200 hours can be used for main work. Leave, meetings, training, breaks, admin tasks, and system issues can reduce the time available for productive work.
Capacity can also be measured by output instead of hours.
For example, if one employee can complete one customer request every 2 hours and has 30 working hours available:
30 ÷ 2 = 15 customer requests per week
This means the employee’s estimated output capacity is 15 requests per week under normal working conditions.
Employee capacity helps managers plan workloads for each team member, assign tasks more fairly, estimate staffing needs, and set realistic deadlines. It shows how much work each employee and the whole team can handle before availability, utilization, quality, and other work conditions are considered.
Read also: Why Capacity Planning Is the Most Underrated Competitive Advantage?
What Is Employee Availability?
Employee availability is the amount of time a team member is ready and free to take on assigned work.
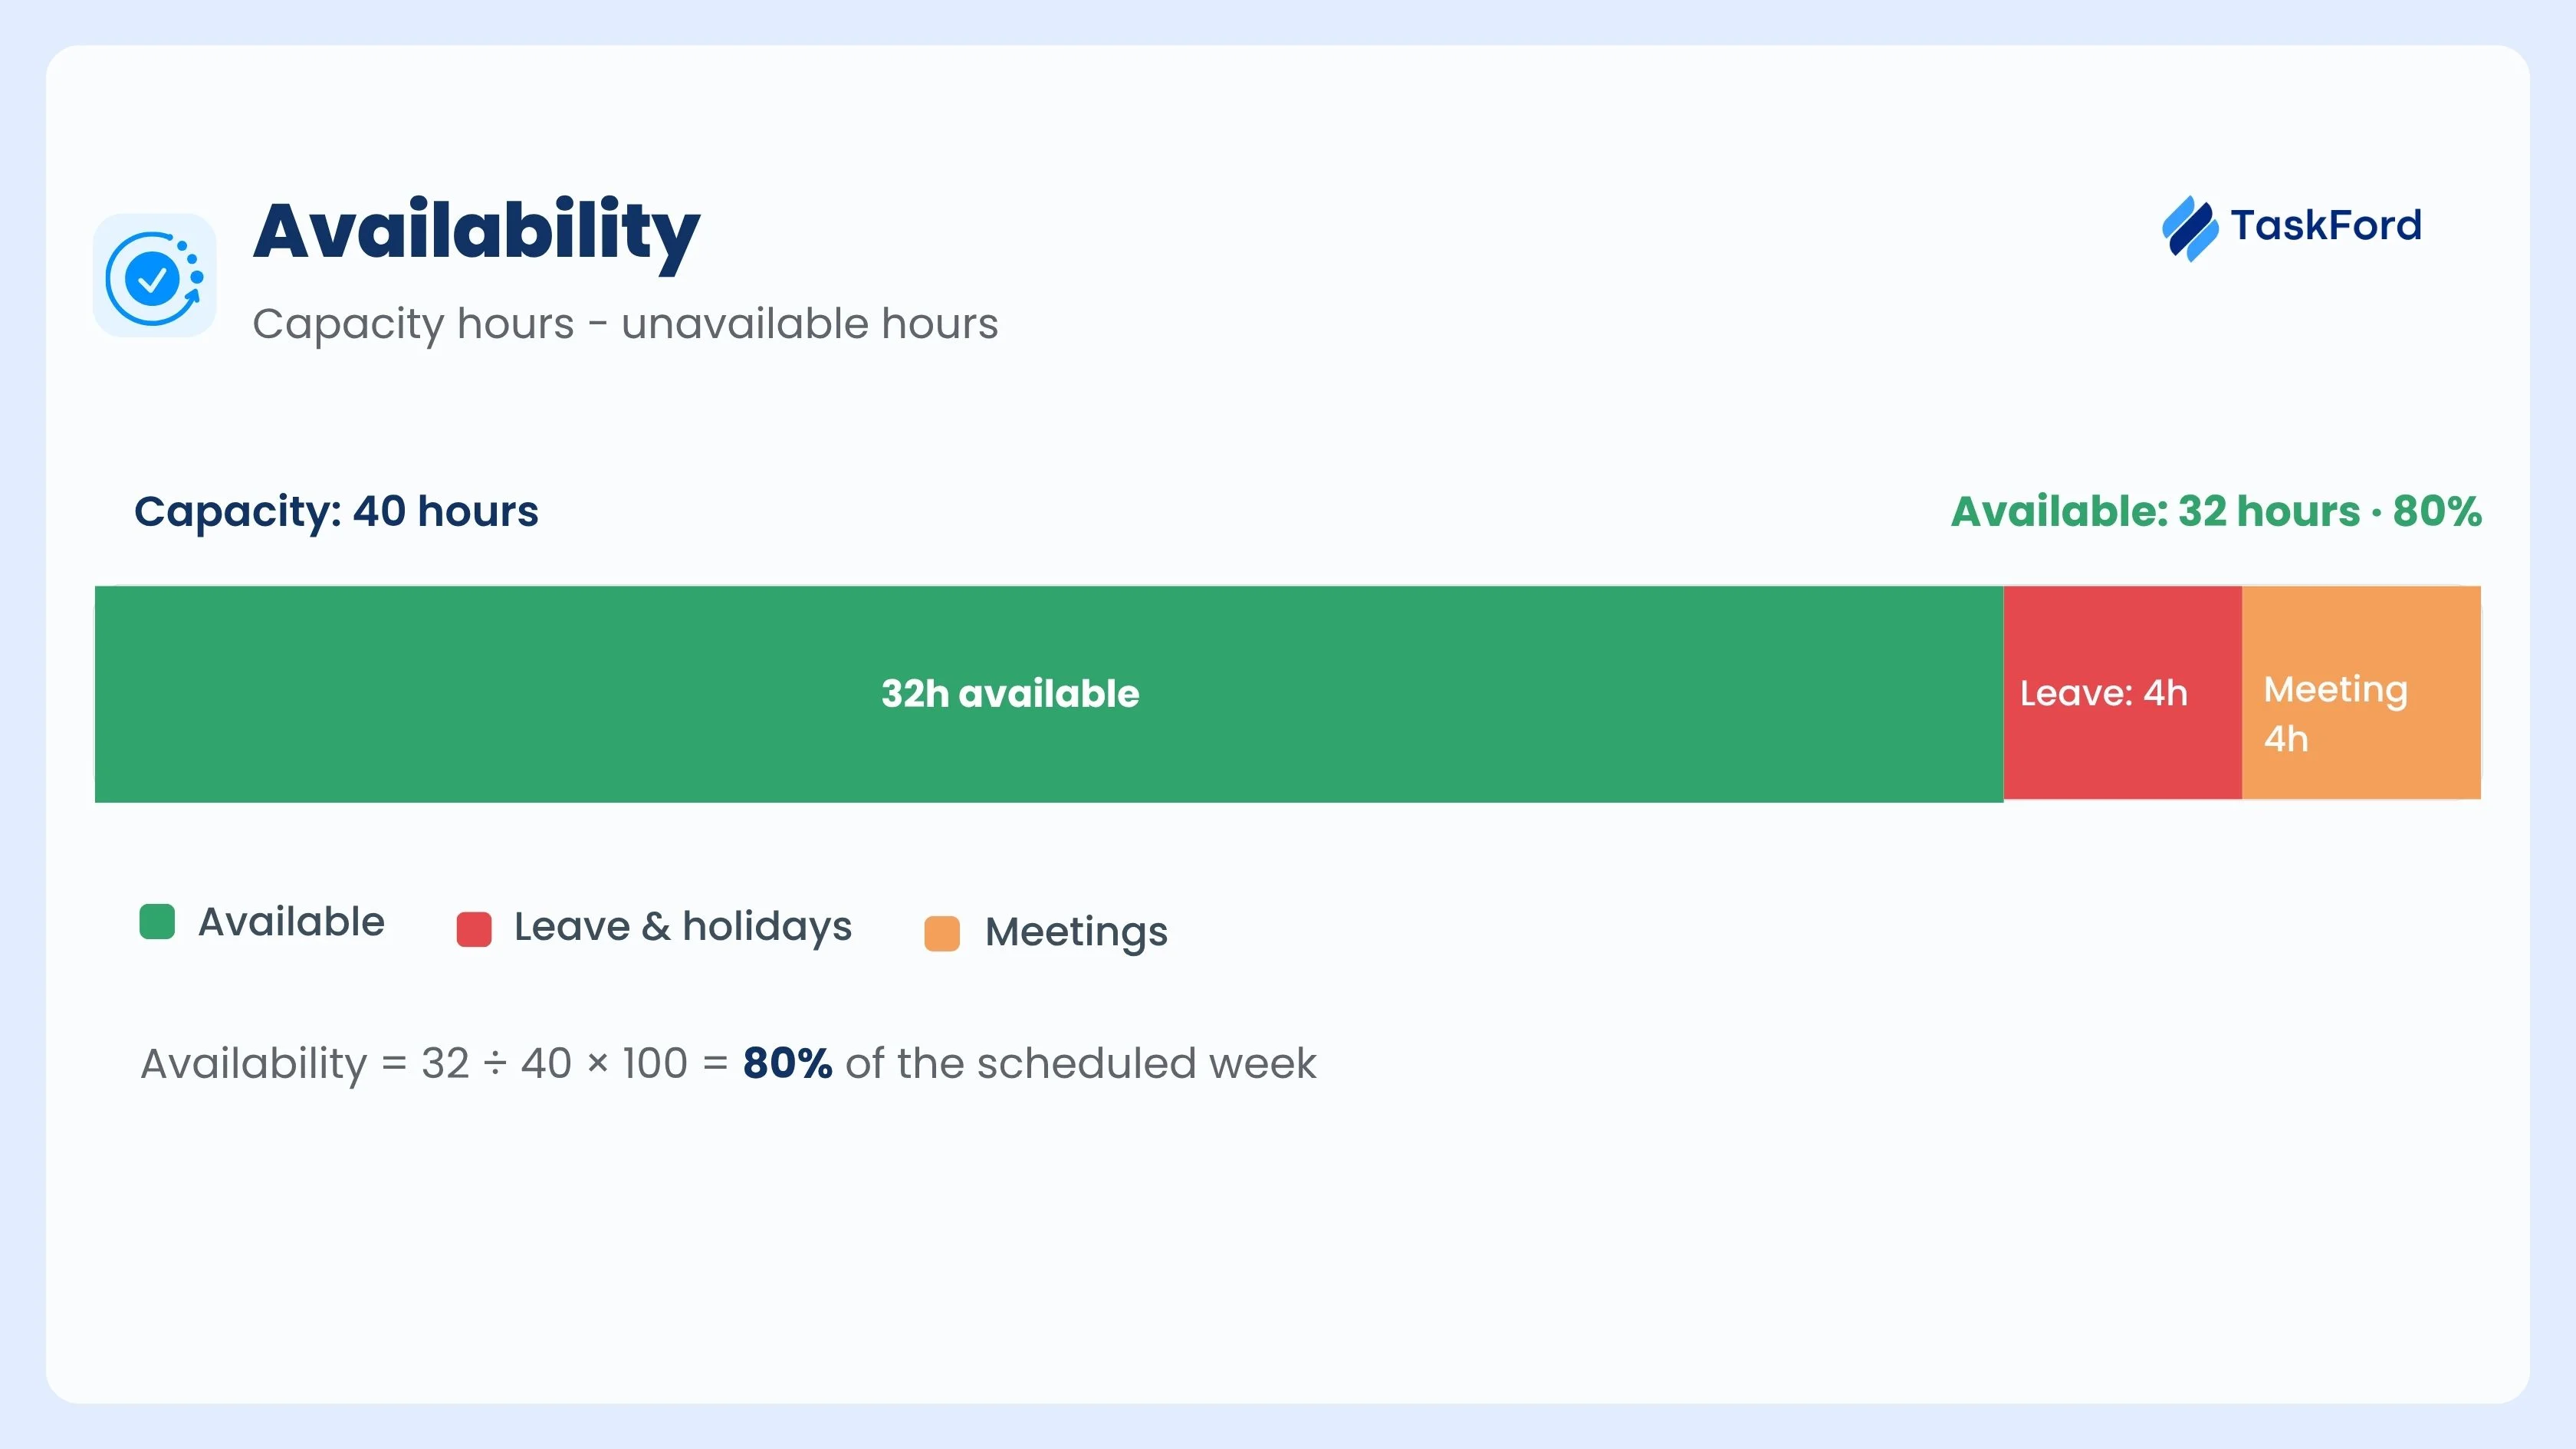
Each employee can have a different level of availability. Their available time depends on scheduled hours, leave, holidays, training, meetings, admin work, and other activities that take time away from regular tasks.
A simple formula is:
Available hours = Scheduled hours − Unavailable hours
For example, an employee is scheduled for 40 hours in one week. They take 4 hours of leave, spend 2 hours in training, and attend 2 hours of meetings.
40 − 4 − 2 − 2 = 32 available hours
The availability rate is:
Availability = Available hours ÷ Scheduled hours × 100
32 ÷ 40 × 100 = 80%
This means the employee is available for 80% of the scheduled week.
Availability should also be reviewed for each team member because working schedules and time off can be different.
| Employee | Scheduled hours | Leave and holidays | Meetings and training | Available hours | Availability rate |
|---|---|---|---|---|---|
| Employee A | 40 hours | 0 hours | 4 hours | 36 hours | 90% |
| Employee B | 32 hours | 8 hours | 2 hours | 22 hours | 68.8% |
| Employee C | 20 hours | 4 hours | 2 hours | 14 hours | 70% |
Availability is different from attendance. An employee can be at work but still be unavailable for regular tasks because they are in training, handling admin work, attending meetings, or supporting another team.
TaskFord helps managers track availability through its leave approval flow and holiday settings. When leave is approved or a holiday is added in the app, the employee’s available time can be reflected in the schedule.
Managers can then review capacity and availability together on the schedule board. This makes it easier to see who is free for new work, who has limited time, and where tasks may need to be moved to another team member.
Employee availability gives managers a more accurate view of the time each person can use for assigned work. It helps them plan workloads based on real schedules instead of using total working hours alone.
What Is Employee Utilization?
Employee utilization is the percentage of available time that each team member spends on productive work.
Constant overload can also affect employee well-being. The World Health Organization’s explanation of burnout connects burnout with chronic workplace stress that has not been managed successfully.
Productive work can include assigned tasks, client work, project work, customer support, or other activities that directly contribute to the team’s goals.
A simple formula is:
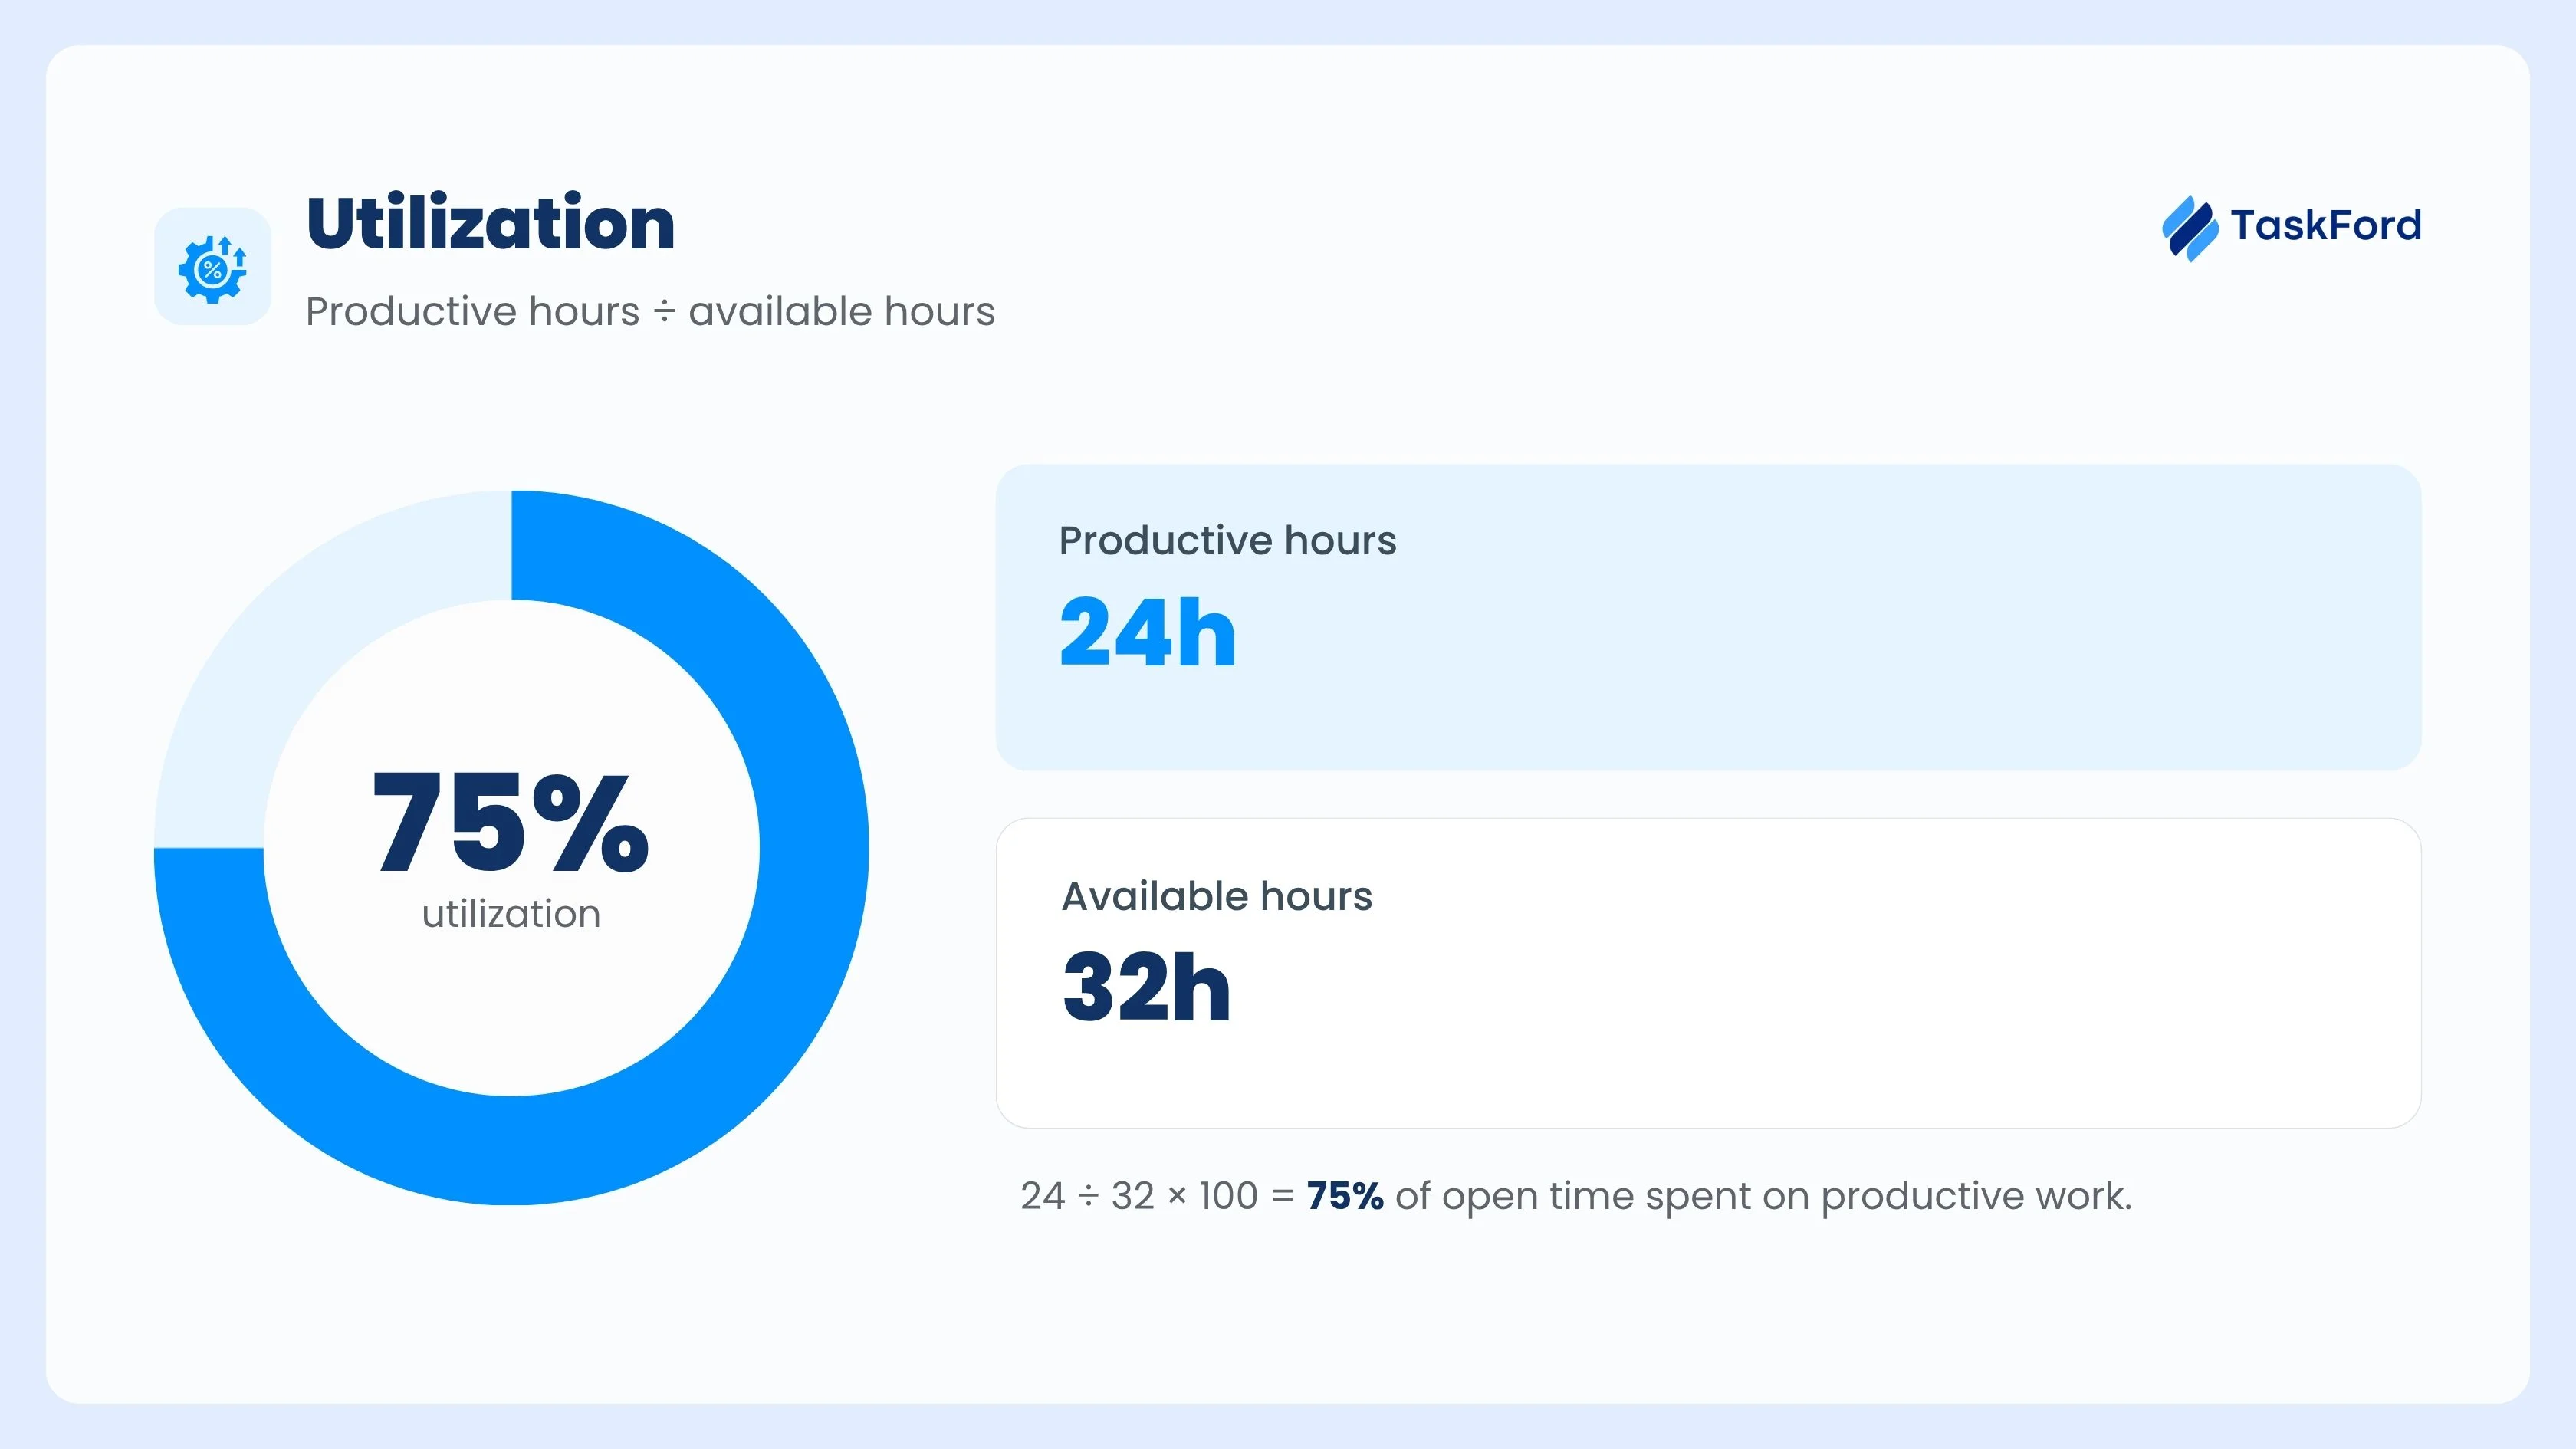
Utilization = Productive hours ÷ Available hours × 100
For example, if an employee has 32 available hours and spends 24 hours on productive work:
24 ÷ 32 × 100 = 75%
This means the employee’s utilization rate is 75%.
Utilization should be calculated for each team member because employees can have different schedules, roles, and workloads.
| Employee | Available hours | Productive hours | Utilization rate |
|---|---|---|---|
| Employee A | 36 hours | 30 hours | 83.3% |
| Employee B | 22 hours | 18 hours | 81.8% |
| Employee C | 14 hours | 9 hours | 64.3% |
This table helps managers see how available time is being used across the team. Employee A and Employee B have similar utilization, even though their available hours are different. Employee C has a lower utilization rate, which may mean they have room for more work.
A low utilization rate does not always mean poor performance. The employee may be waiting for new tasks, approvals, information, or support from another team. Their role may also require time for planning, training, or internal work.
A high utilization rate also does not always mean strong performance. An employee can spend most of their available time working but still complete less than expected because of complex tasks, slow systems, repeated changes, or rework.
Managers should avoid treating 100% utilization as the ideal target. Employees need some open time for planning, communication, urgent requests, and unexpected problems. Keeping every team member fully utilized for long periods can increase stress and reduce work quality.
Employee utilization is most useful when managers compare it with availability, workload, throughput, and quality. This gives a clearer view of whether each employee has too much work, too little work, or a reasonable workload.
Read also: What Is Utilization Rate? How to Calculate and Interpret It Correctly
What Is Employee Throughput?
Employee throughput is the amount of completed and accepted work each team member delivers during a set period.
It can be measured in tasks, customer requests, calls, orders, reports, or projects. The right measure depends on the employee’s role.
First, calculate the amount of accepted work:
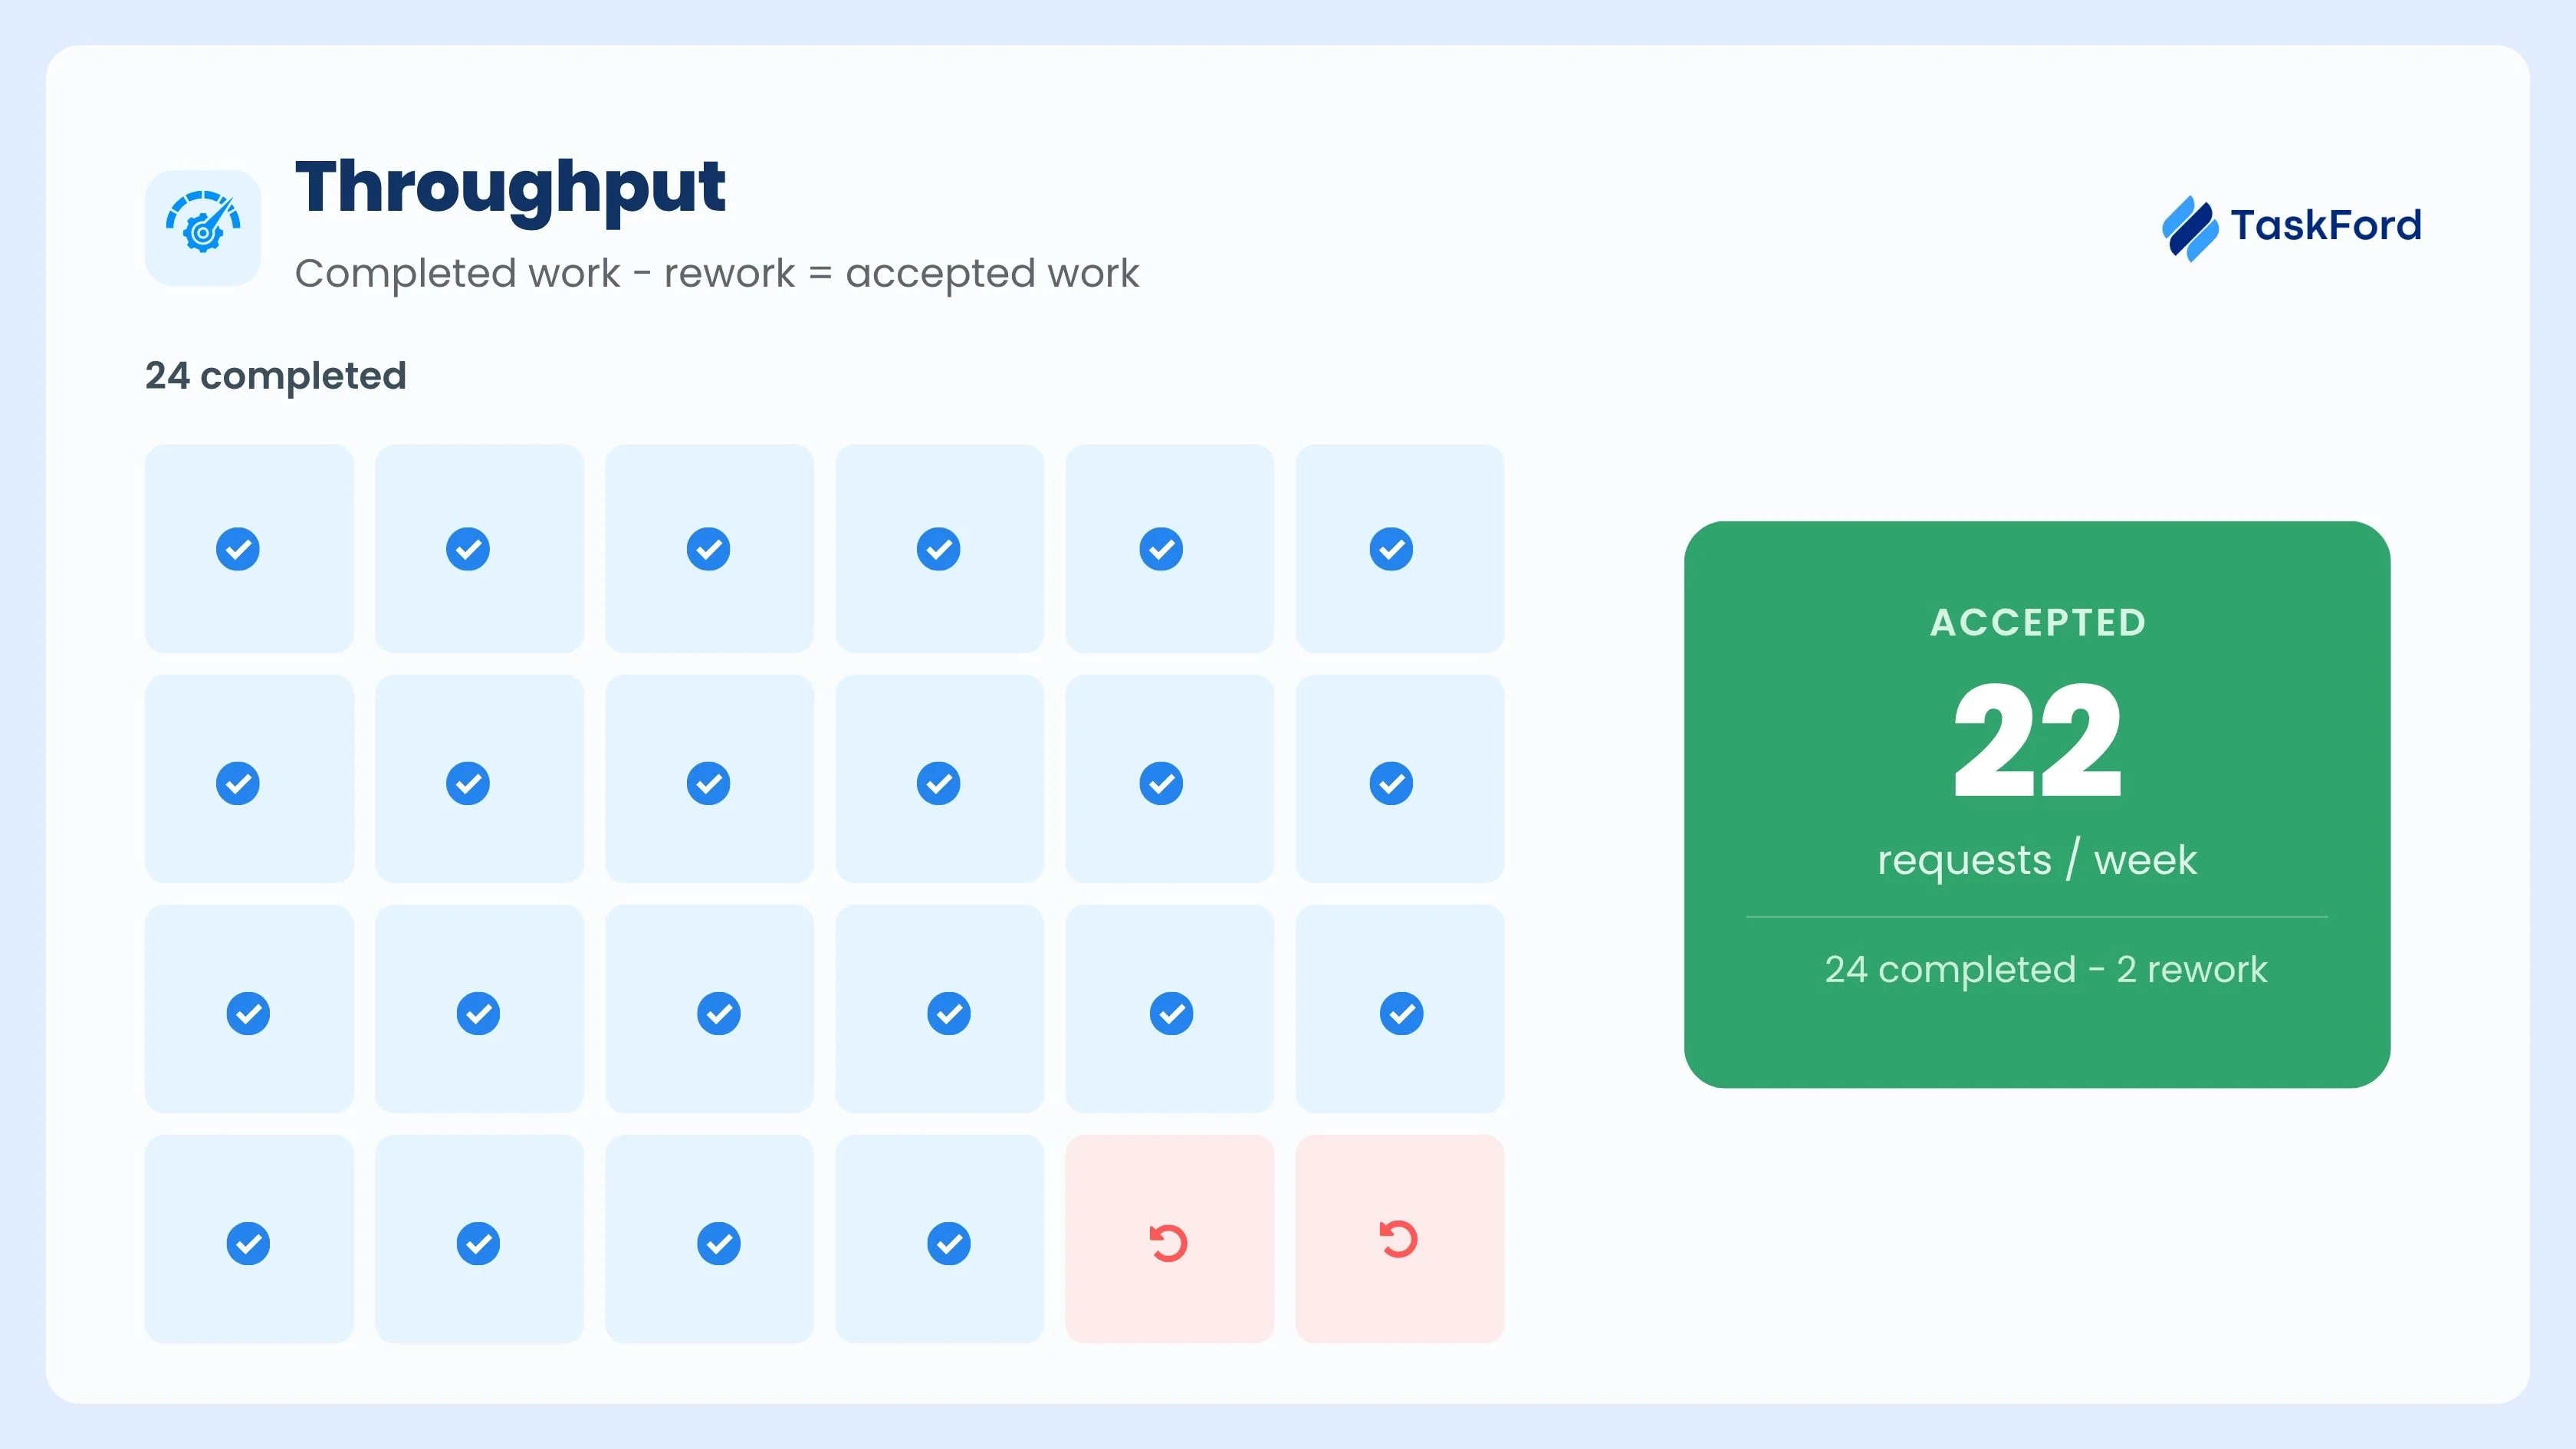
Accepted work = Completed work − Rejected or reworked work
Then calculate the throughput rate:
Throughput rate = Accepted work ÷ Time period
For example, an employee completes 24 customer requests in one week, but 2 need to be redone.
Accepted work = 24 − 2 = 22 customer requests
Throughput rate = 22 ÷ 1 week = 22 customer requests per week
Throughput should be reviewed for each team member because employees can handle different types of work and different levels of difficulty.
| Employee | Completed work | Rework | Accepted work | Throughput rate |
|---|---|---|---|---|
| Employee A | 24 tasks | 2 tasks | 22 tasks | 22 tasks per week |
| Employee B | 18 tasks | 1 task | 17 tasks | 17 tasks per week |
| Employee C | 12 tasks | 0 tasks | 12 tasks | 12 tasks per week |
Throughput focuses on finished results, not just time spent. An employee can be busy all day and still have low throughput if work is delayed, incomplete, blocked, or returned for correction.
Throughput is also different from productivity. Throughput shows how much accepted work is completed during a period. Productivity shows how much accepted work is completed for each productive hour.
Managers should compare throughput with available time, task difficulty, and work quality. This gives a fairer view of each employee’s results.
For example, Employee A may complete 22 accepted tasks in 30 productive hours, while Employee B completes 17 accepted tasks in 18 productive hours. Employee A has higher throughput, but Employee B has higher output per hour.
Tracking throughput for each team member helps managers see whether employee time is turning into completed work. It also helps them spot delays, rework, blocked tasks, and workload problems.
How the Four Metrics Work Together
Capacity, availability, utilization, and throughput measure different parts of employee work.
The flow is:
Capacity → Availability → Utilization → Throughput
Complete Employee Example
Consider this weekly example:
- Scheduled capacity: 40 hours
- Leave: 4 hours
- Training: 2 hours
- Meetings: 2 hours
- Productive work: 24 hours
- Completed customer requests: 24
- Requests accepted without rework: 22
The results are:
| Metric | Calculation | Result |
|---|---|---|
| Capacity | Total scheduled time | 40 hours |
| Available hours | 40 − 4 − 2 − 2 | 32 hours |
| Availability rate | 32 ÷ 40 × 100 | 80% |
| Utilization rate | 24 ÷ 32 × 100 | 75% |
| Completed work | Total completed requests | 24 requests |
| Accepted work | 24 − 2 | 22 requests |
| Throughput rate | 22 ÷ 1 week | 22 requests per week |
The employee starts with 40 hours of capacity. After leave, training, and meetings, 32 hours remain available. The employee uses 24 of those hours for productive work. This produces 24 completed requests, but 2 need to be redone, leaving 22 accepted requests.
How to Read Different Employee Scenarios
Managers should review the metrics together instead of judging performance from one number.
| Availability | Utilization | Throughput | What it can mean |
|---|---|---|---|
| High | High | High | The employee has enough work and completes it well |
| High | Low | Low | There may not be enough assigned work |
| Low | High | Low | Limited available time is reducing output |
| High | High | Low | Delays, rework, or difficult tasks are slowing results |
| High | Medium | High | The employee is productive without being overloaded |
| Low | Low | Low | Leave, scheduling, workload, or process issues need review |
These patterns need context. Low throughput does not always mean poor employee performance. The employee may be waiting for approval, using slow systems, handling more difficult work, or correcting earlier errors.
Reviewing capacity, availability, utilization, and throughput together gives managers a clearer view of employee workload and results.
How Managers Can Track Employee Performance with Taskford
1. Plan Employee Capacity
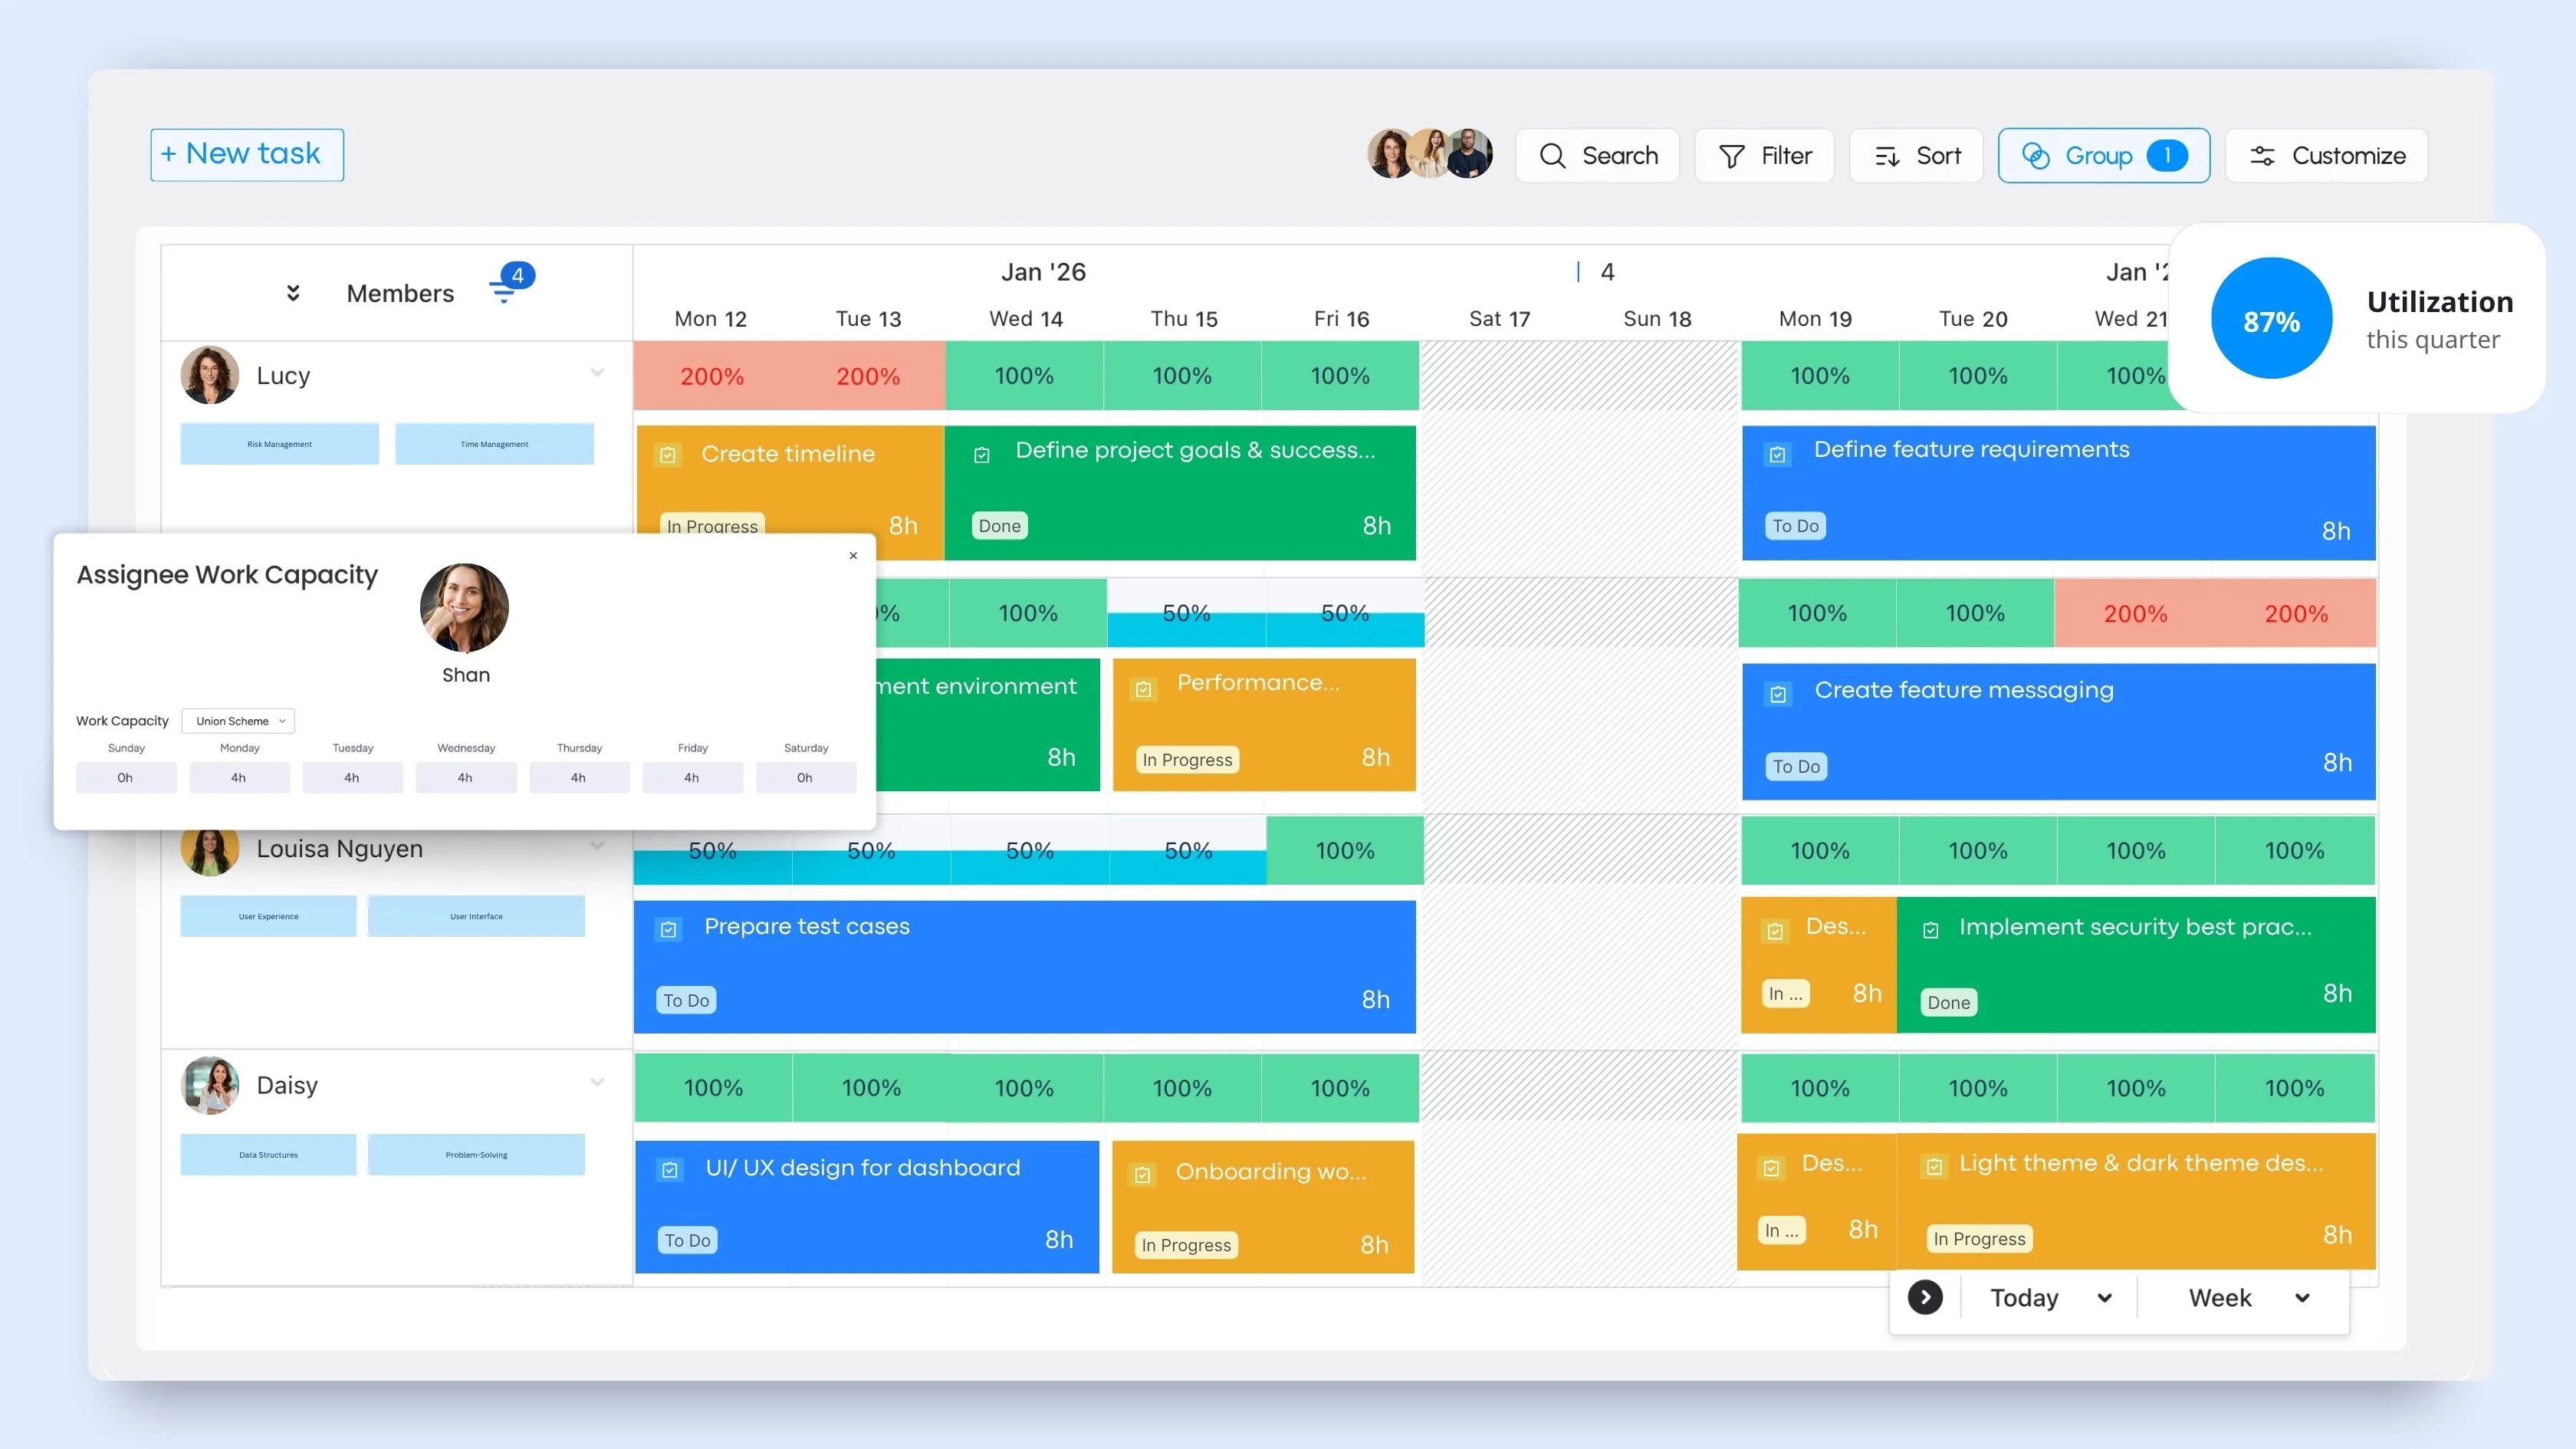
Managers can set custom capacity for each team member by day. This makes it easier to plan work based on each person’s schedule, role, and expected workload.
2. Check Availability
Taskford includes holiday and leave approval workflows. Once leave is approved, the employee’s availability is reflected in the schedule.
By viewing availability together with capacity on the schedule board, managers can quickly see who is available for new work and who has limited time.
3. Balance Utilization
Taskford automatically calculates workload balance for each team member. Managers can see who is overloaded, underloaded, or working within their planned capacity.
This helps them reassign tasks before workload problems lead to delays or burnout.
4. Track Throughput
Managers can assign work and compare available capacity, planned work, and actual completed work.
This makes it easier to see whether tasks are being completed as expected and where delays or workload gaps are affecting team output.
Common Mistakes When Measuring Employee Performance
These metrics can be useful, but only when they are measured correctly.
Using scheduled hours as available hours
Scheduled hours include time that cannot always be used for regular work. Leave and holidays should be removed before calculating availability.
Treating high utilization as high performance
A busy employee is not always a productive employee. Time can be spent on rework, low-value tasks, or work blocked by other teams.
Ignoring task difficulty
Ten simple tasks are not the same as ten complex tasks. Workload and output should be compared with the type of work being handled.
Measuring activity instead of results
Emails sent, hours logged, and meetings attended show activity. They do not show whether useful work was completed.
Ignoring quality
High output can look positive even when the work contains errors. Throughput should focus on completed work that meets the required standard.
Blaming the employee for process problems
Low output can come from slow systems, unclear instructions, approval delays, or poor workload planning. These issues should be checked before judging individual performance.
Conclusion
Employee capacity, availability, utilization and throughput measure different parts of the same work process.
Capacity shows how much work an employee can handle. Availability shows how much time is open for work. Utilization shows how much of that time is used productively. Throughput shows how much work is completed and accepted.
Managers get the clearest view when they review these metrics together. This helps them plan realistic workloads, spot overload or underuse, and understand why output changes.
Taskford brings this information into one place by combining capacity planning, leave and holiday data, workload balance, and actual work results. This gives managers a clearer way to plan work and improve team performance.
Related Blogs:
Related Articles














































































![What is an Effective Resource Management Plan Template [Free Download]](/marketing/blog/resource-management-plan-template.webp)




Subscribe for Expert Tips
Unlock expert insights and stay ahead with TaskFord. Sign up now to receive valuable tips, strategies, and updates directly in your inbox.