How Teams Use Gantt Charts to Manage Multiple Projects: Real-World Use Cases
Discover how teams in different industries use multi-project Gantt charts to organize schedules, handle shared resources, and avoid delays across many projects.
Managing several projects at once is challenging when each one has different timelines, team members, and requirements. A multi-project Gantt chart helps by bringing everything into one place. It shows what is happening, when it is happening, and who is responsible.
In this guide, you will see practical use cases from different industries and how a Gantt chart for multiple projects supports planning, resource decisions, and daily coordination. You will also learn how TaskFord makes it easier to manage all projects in a single view.
Why Gantt Charts Are Essential for Managing Multiple Projects
When juggling multiple projects, it becomes challenging to visualize timelines, manage resource allocation, and track dependencies. A well-structured Gantt chart gives you a bird’s-eye view of everything in motion.
According to ResearchGate, an empirical analysis focusing on developing countries revealed that sectors such as construction, IT, and manufacturing exhibit high adoption rates of Gantt charts. This is attributed to the structured nature of their projects, where Gantt charts enhance visibility and control over project timelines and task sequencing.
The Complexity of Multi-Project Planning
Multiple teams, overlapping deliverables, shared resources, and interdependent tasks all add layers of complexity. Without a visual system, things fall through the cracks. Gantt charts eliminate guesswork by laying everything out on a shared timeline.
Benefits of Using a Gantt Chart
- Visual clarity: View all project tasks and timelines in one place.
- Task dependencies: Easily identify critical paths and overlaps.
- Resource allocation: Prevent overallocation or resource clashes.
- Milestone tracking: Keep stakeholders informed with clear progress updates.
Common Multi-Project Scenarios That Require a Gantt Chart
Managing multiple projects becomes significantly easier when you can see how work overlaps, how resources move across teams, and where potential delays may occur. The following scenarios are where a multi-project Gantt chart delivers the most value:
1. Agencies handling multiple clients at once
Creative, consulting, and marketing agencies often manage 10–40 active client projects. Each client has unique timelines, deliverables, and approval processes. A shared Gantt chart helps track all client commitments in one place.
2. Product and engineering teams balancing roadmap + client work
Development teams frequently work on core product updates while delivering custom features or integrations for clients. When these streams overlap, a unified timeline prevents overloaded sprints and missed release windows.
3. Construction companies coordinating crews and equipment across sites
Teams must schedule labor, heavy equipment, and inspections across several active locations. A multi-project Gantt chart prevents double-booked crews and equipment conflicts.
4. Marketing departments running overlapping campaigns
Campaigns often share designers, copywriters, analysts, and approval cycles. A combined Gantt view reveals peak workload periods and conflicting launch dates.
5. Operations teams coordinating cross-department initiatives
When multiple departments contribute to shared outcomes, a portfolio-level timeline helps keep handoffs, dependencies, and milestones aligned.
Use Cases: How Various Industries Use Gantt Charts in Multiple Projects
Use Case 1: Construction Companies Managing Multiple Sites
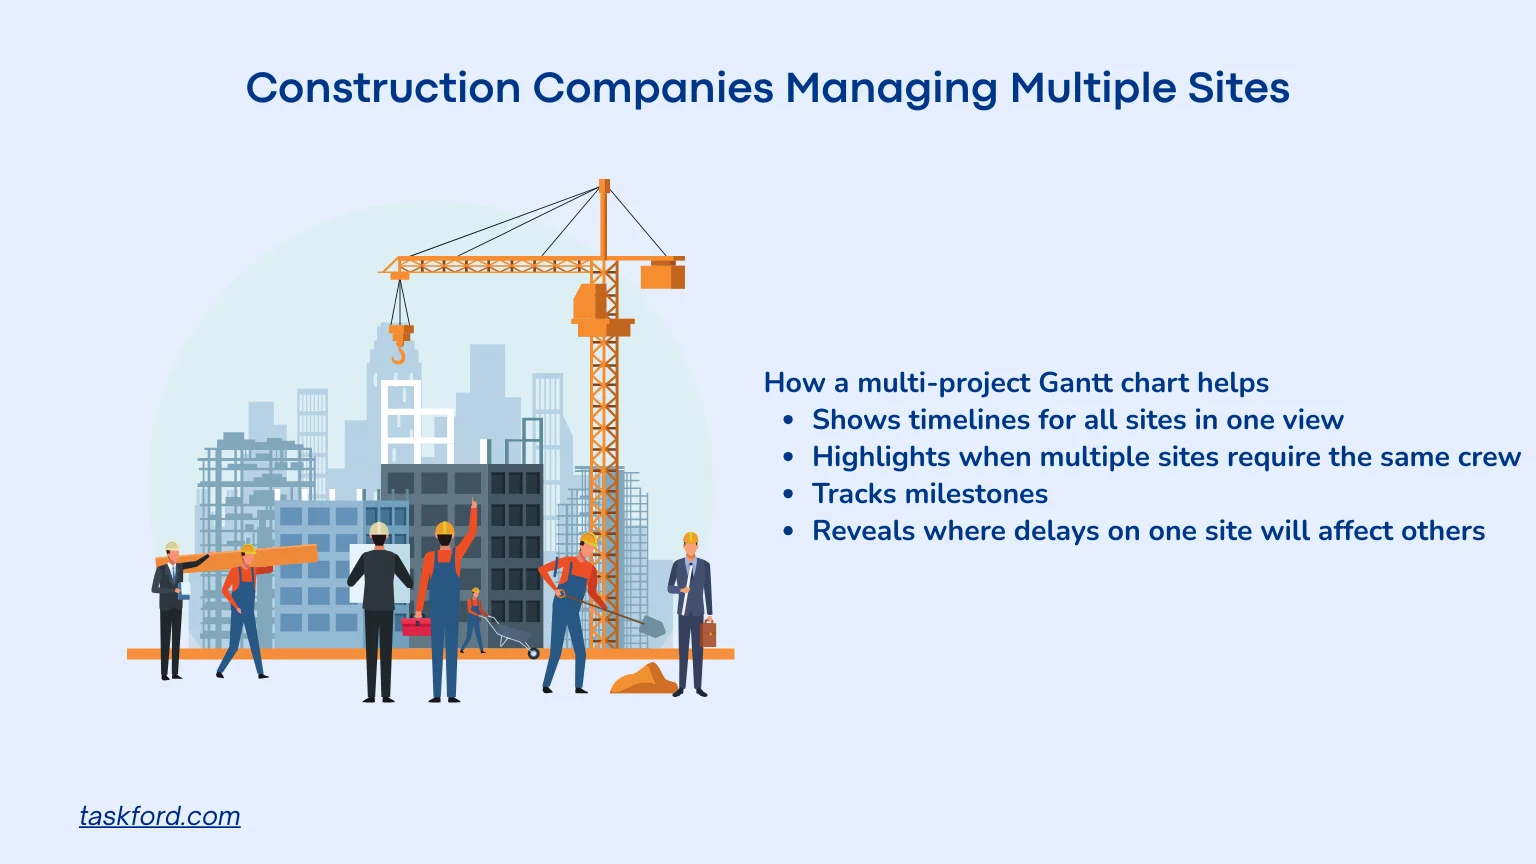
Construction teams often run several sites at the same time, each with its own contractors, permits, supply deliveries, inspections, and weather-related constraints. When these projects operate on different schedules, managers struggle to coordinate labor crews, heavy equipment, and material deliveries across locations. Without a unified view, delays on one site can cascade into others because resources are shared and availability is limited.
How a multi-project Gantt chart helps
- Shows project timelines for all sites in one view
- Highlights when multiple sites require the same crew or equipment
- Tracks milestones tied to inspections, permits, or supplier commitments
- Reveals where delays on one site will affect others
Example
A contractor might be handling a residential build, renovating a commercial space, and preparing groundwork for a new retail site. Each location needs electricians, carpenters, concrete teams, and specialty equipment at different times. Without a shared timeline, the manager may only see the schedule inside each project, not noticing that three sites require the same concrete subcontractor in the same week.
A multi-project Gantt chart lays all site schedules side by side. It becomes immediately clear where labor conflicts appear, when equipment is double-booked, and where a delayed inspection at one site will push critical tasks into already crowded windows. With this insight, managers can shift crews, reschedule deliveries, and prevent expensive standstills before they occur.
Use Case 2: Software Teams Balancing Product Roadmaps + Client Work
Software teams, or IT project management teams in general, often build their core product while also delivering custom client implementations, integrations, or feature requests. Each stream has its own deadlines, testing phases, dependencies, and feedback cycles. When these schedules are handled separately, engineering leaders lose visibility into how sprint commitments, release cycles, and client deliverables overlap. This leads to overloaded developers and unpredictable release dates.
How a multi-project Gantt chart helps
- Combines roadmap, sprints, and client projects into one schedule
- Shows when developers are overallocated across product and client work
- Visualizes dependencies between design, development, QA, and deployment
- Reveals where shifting one release impacts other deliverables
Example
A software company might be preparing a core product update while also implementing custom integrations for several enterprise clients. The same engineers may be responsible for both roadmap features and client-specific work. When tasks are tracked separately, managers overlook that a developer committed to a release milestone is also expected to deliver an integration for a high-priority client in the same sprint.
With a multi-project Gantt chart, all roadmap items and client projects appear on a unified timeline. Overlapping workloads become clear, especially where design, backend, and QA need the same people. Managers can see where shifting a client deadline affects the release schedule or where testing phases collide across multiple projects. This visibility helps the team plan sprints realistically and keep both product development and client work on track.
Use Case 3: Marketing Teams Running Many Campaigns at Once
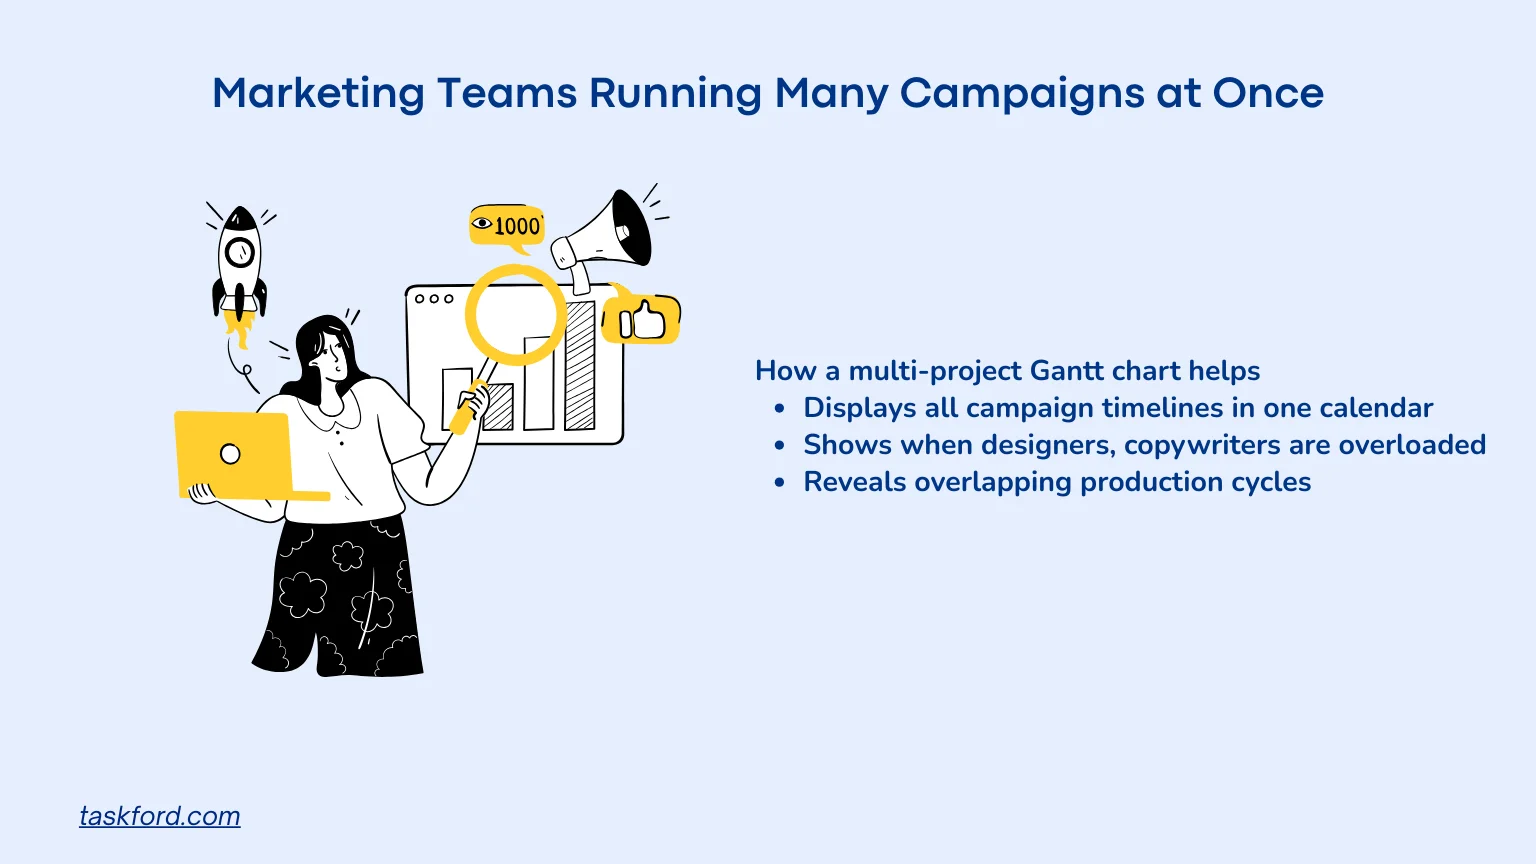
Marketing project management teams often run dozens of simultaneous campaigns across channels such as social, paid ads, email, partnerships, events, and content. Each campaign has its own creative tasks, review cycles, asset dependencies, and launch windows. When these timelines exist in separate boards or spreadsheets, teams lose track of overlapping production cycles and risk scheduling multiple launches on the same week with the same limited resources.
How a multi-project Gantt chart helps
- Displays all campaign timelines in one unified calendar
- Shows when designers, copywriters, or analysts are overloaded
- Reveals overlapping production cycles across different channels
- Tracks approval and revision loops that affect launch timing
Example
A marketing department might be preparing a product launch, planning a brand campaign, coordinating weekly content, and managing seasonal promotions. Each initiative requires creative work, stakeholder reviews, and data tracking. When these schedules live in different tools, the team can’t easily see that several major campaigns demand assets from the same creative team at the same time.
A multi-project Gantt chart places all campaign schedules on a single timeline. The team immediately spots when multiple campaigns peak in the same production window, when approval cycles will constrain turnaround, and where analyst bandwidth will be stretched thin across reporting deadlines. This clarity helps marketing leaders adjust launch dates, redistribute work, and maintain consistent quality across every campaign.
Use Case 4: Event Management Companies Coordinating Multiple Events
Event teams often plan several events at the same time. Each one needs venues, vendors, creative assets, rehearsals, contracts, and approvals. When these schedules are kept in different places, teams miss conflicts in vendor availability and production timelines.
How a multi-project Gantt chart helps
- Shows all event timelines side by side
- Highlights resource conflicts for designers, coordinators, or vendors
- Tracks dependencies like venue availability or rehearsal schedules
- Reveals when multiple events peak during the same week
Example
An event agency may be planning a corporate summit, a charity gala, and a product launch for a tech client. Each event requires its own venue booking, staging setup, creative assets, and vendor coordination. The same design team is responsible for all event materials, and the same production crew handles staging and lighting.
Without a unified timeline, the agency might not notice that all three events require final creative delivery in the same week. They also may not see that the staging crew is booked for setup at two venues during overlapping days. With a multi-project Gantt chart, the agency can view each event’s tasks side by side, spot where crew capacity is overloaded, and identify where vendor schedules conflict. This allows managers to shift rehearsals, reschedule deliveries, or assign backup vendors so all events run smoothly.
Use Case 5: Manufacturing Teams Balancing Production Lines
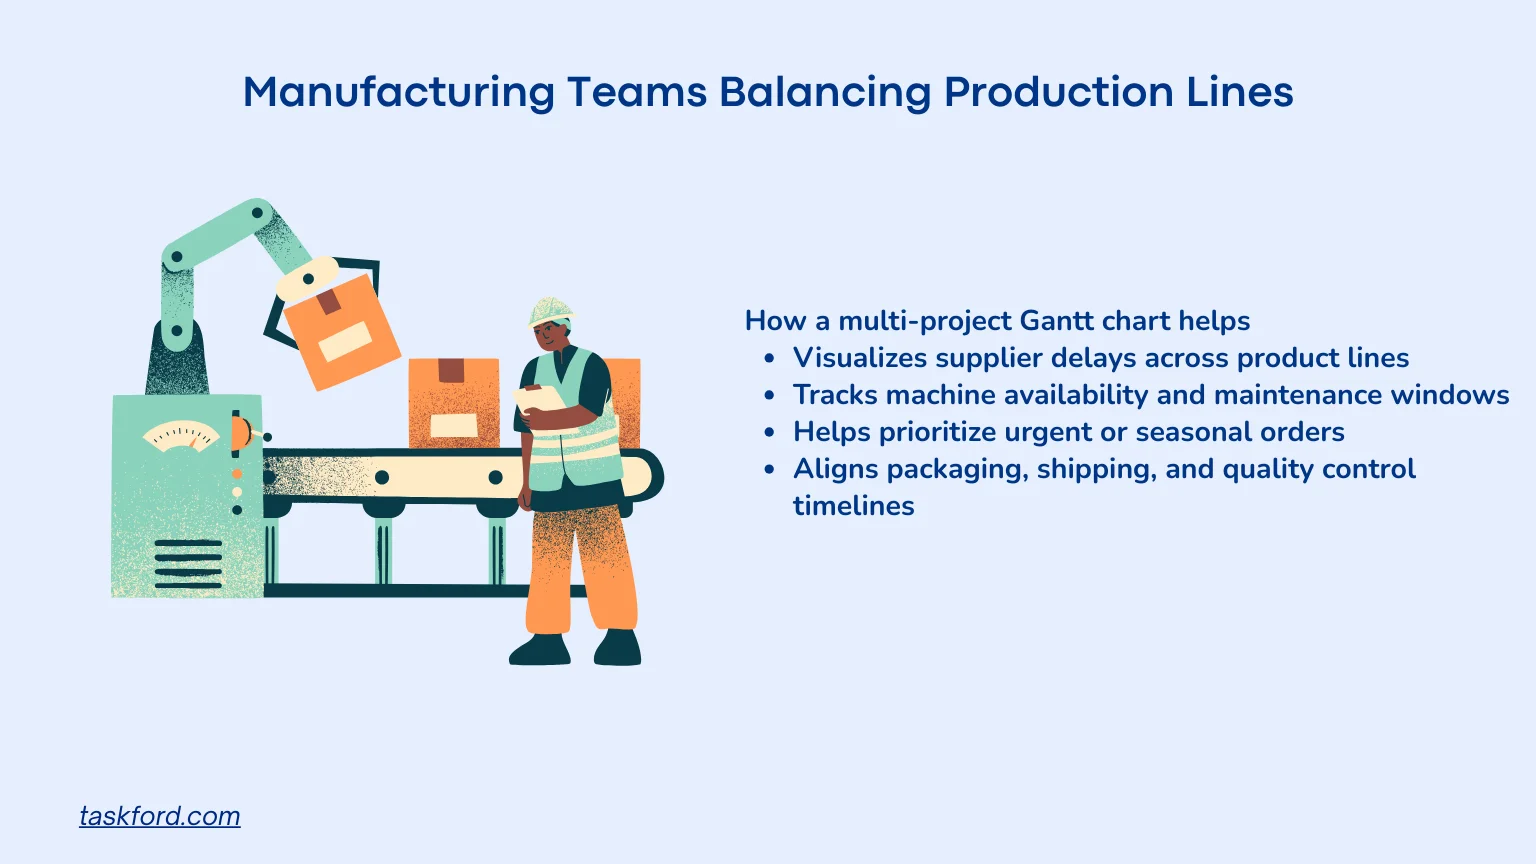
Manufacturers often run several production plans at once, including routine orders, custom requests, prototype builds, maintenance, and QA checks. When these timelines are separated, teams may miss machine conflicts or supplier delays that impact multiple orders.
How a multi-project Gantt chart helps
- Visualizes supplier delays across product lines
- Tracks machine availability and maintenance windows
- Helps prioritize urgent or seasonal orders
- Aligns packaging, shipping, and quality control timelines
Example
A factory might be producing a standard product line while also working on a custom order and preparing a prototype for a new client. All three require the same key machine and the same QA team. The prototype also depends on a special component from a supplier.
If these schedules are tracked separately, the production manager may not see that all three jobs need the same machine during the same week. They also may not notice that the supplier’s delay on the prototype component will push testing into a week when QA is already full. A multi-project Gantt chart shows all runs together, making machine conflicts and workload peaks visible. The manager can then rearrange production, adjust machine maintenance, and speak with the supplier early to keep output moving.
Use Case 6: Retail & E-Commerce Teams Managing Seasonal Launches
Retail companies manage promotions, product launches, store layout changes, inventory updates, and seasonal campaigns. Since these tasks rely on stock arrival, artwork approval, and staff capacity, separate timelines can lead to store overloads.
How a multi-project Gantt chart helps
- Shows when multiple launches overlap
- Tracks creative assets, pricing updates, and inventory readiness
- Helps coordinate with suppliers and warehouses
- Prevents overloaded launch weeks during peak season
Example
A retail chain may plan a spring sale, a footwear display update, a new loyalty program rollout, and a backroom inventory clean-up. Each one needs stock deliveries, signage, creative assets, and store setup time. Staff still handle daily tasks like restocking and customer service.
If these plans are tracked separately, store teams may end up changing displays the same week the spring sale starts. They may also be asked to install loyalty program posters before the printed materials arrive. A multi-project Gantt chart puts all activities on the same timeline. Managers can immediately see that the spring sale launch and the footwear display update overlap. They can move the display work earlier, plan staffing more realistically, and avoid overwhelming store teams.
How to Create a Gantt Chart for Multiple Projects
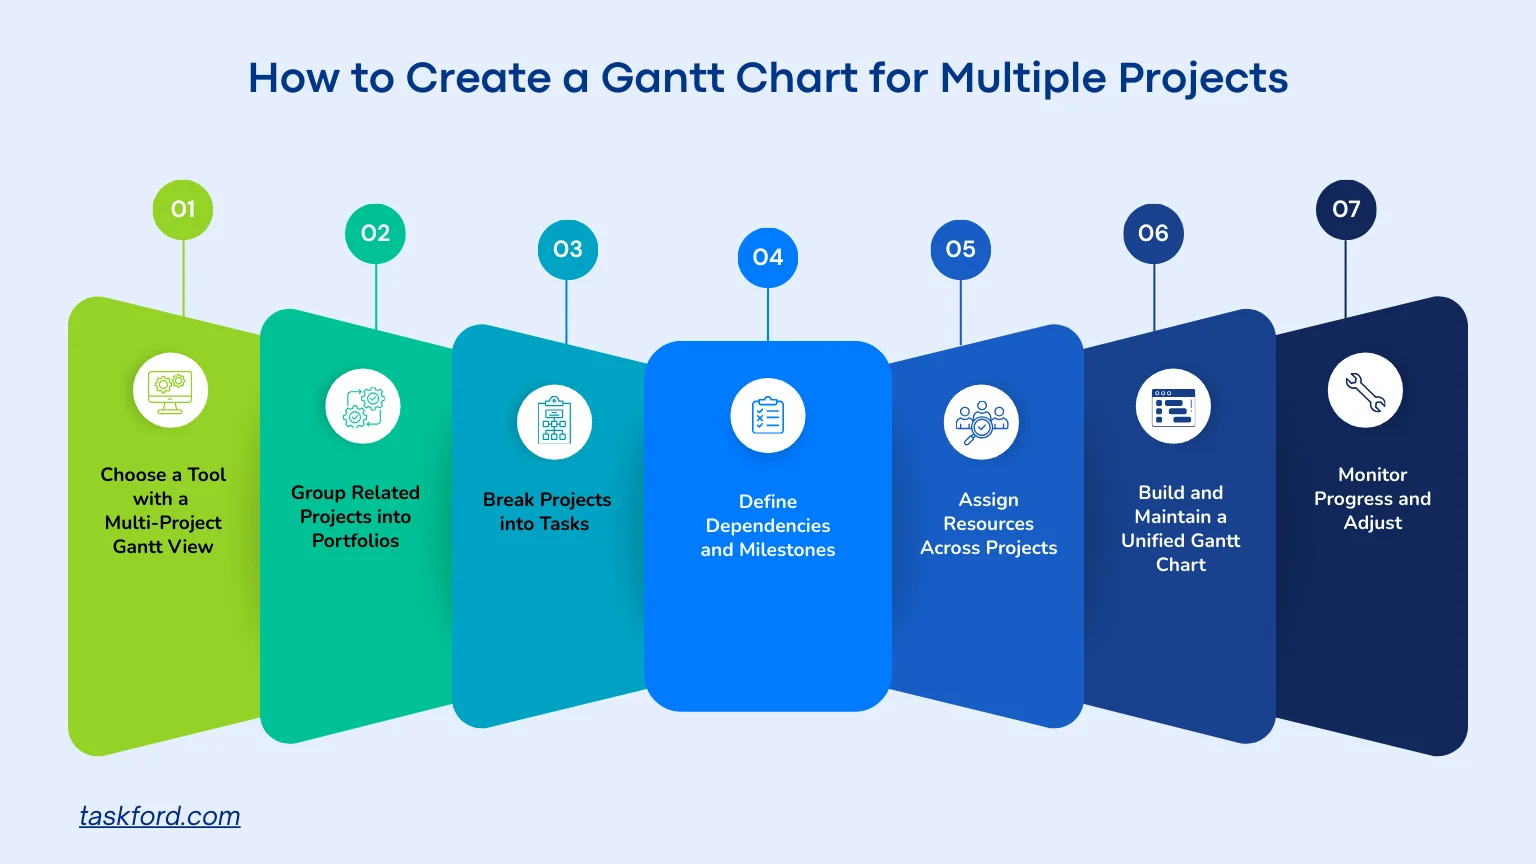
Managing multiple projects in parallel requires more than just listing tasks, it demands a cohesive, coordinated approach to planning, execution, and monitoring. Below is a comprehensive walkthrough designed to help you develop a scalable and efficient Gantt chart for multi-project environments.
Step 1. Choose a Tool with a Multi-Project Gantt View
Use a platform that can display several projects in one timeline. TaskFord supports cross-project tasks, dependencies, and workload balancing.
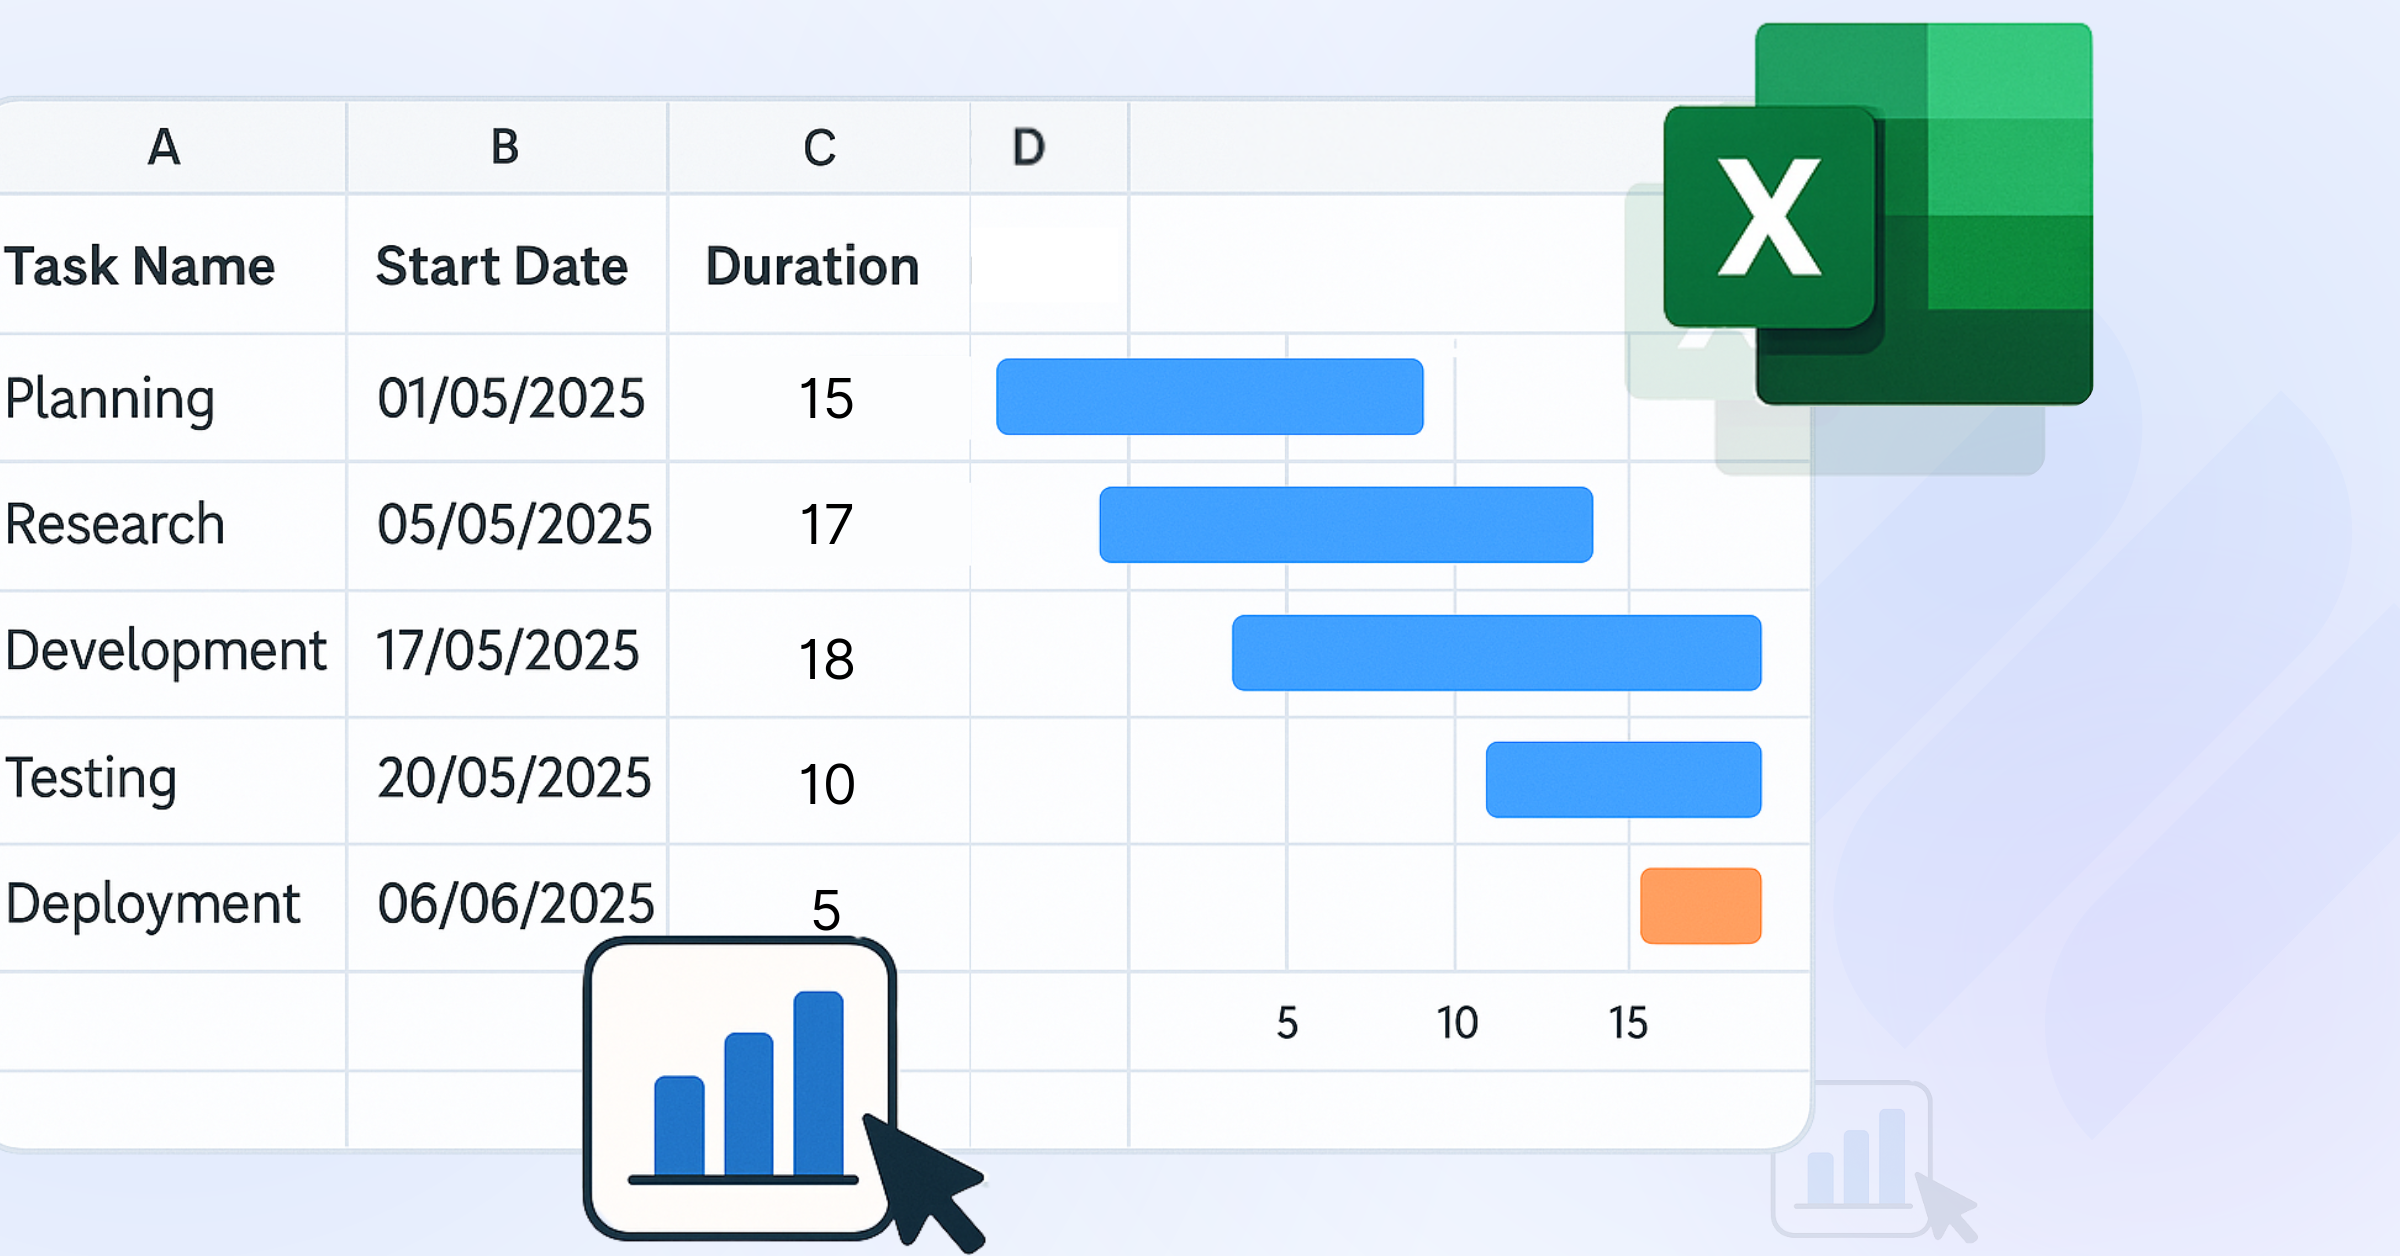
Excel can work but requires manual updates and has limited conflict detection. That’s why you must learn How to Make a Gantt Chart in Excel.
Step 2. Group Projects into Programs or Portfolios
Organise related projects together so you can view them as a coordinated set. This makes it easier to align timelines, spot shared work, and manage resources.
Step 3. Break Each Project into a Task Hierarchy
Create a Work Breakdown Structure to break each project into phases, tasks, and subtasks. A WBS combined with a Gantt chart will create a WBS Gantt chart that helps you map scope, assign durations, define responsibility, and schedule work more accurately across multiple projects.
Step 4. Add Dependencies and Key Milestones
Define which tasks must happen first and mark major checkpoints. This helps you see the critical path and prevents delays that can affect several projects.
Step 5. Assign Resources Across Projects Carefully
Check team availability before assigning work. Look for overlapping demands and prioritise tasks based on business goals to avoid overload.
Step 6. Build a Combined Gantt Chart
Place all projects on one timeline. Use consistent colours or labels, group related tasks, and highlight milestones and critical paths. This creates a clear, unified view of all schedules.
Step 7. Monitor and Adjust
Review the chart regularly. Update task status, deadlines, and dependencies as work changes. Use filters to focus on specific teams or projects. Real-time updates in TaskFord help keep every project aligned.
KPIs You Can Track Using a Multi-Project Gantt Chart
A multi-project Gantt chart is more than a visual timeline—it’s a measurement tool. Tracking the right KPIs helps teams understand performance, anticipate delays, and make informed decisions across the entire portfolio.
- Planned vs. Actual Timeline: Shows whether projects are progressing according to schedule. Useful for identifying delays early.
- Milestone Completion Rate: Tracks how many major milestones are completed on time across all active projects.
- Resource Utilization Rate: Measures how much capacity each team or individual is using, helping prevent burnout and overallocation.
- Cross-Project Dependency Risks: Monitors tasks that have the highest impact across multiple projects, highlighting where delays may cascade.
- On-Time Task Completion Percentage: Shows productivity and reliability at the task level for each project or team.
- Portfolio Progress Percentage: Provides a high-level view of progress across all projects in a program or portfolio.
- Number of Resource Conflicts per Week or Month: A practical KPI that reveals whether teams are being overscheduled or pulled in conflicting directions.
Example of a Gantt Chart for Multiple Projects Using TaskFord
Let’s look at a practical example of how TaskFord, an integrated work delivery platform, visualizes multiple projects in a single Gantt chart.
In this case, the portfolio includes two related initiatives: Sales and Marketing. Each project is organized using a clear Work Breakdown Structure (WBS), with phases, tasks, and subtasks displayed in a hierarchical format on the left.
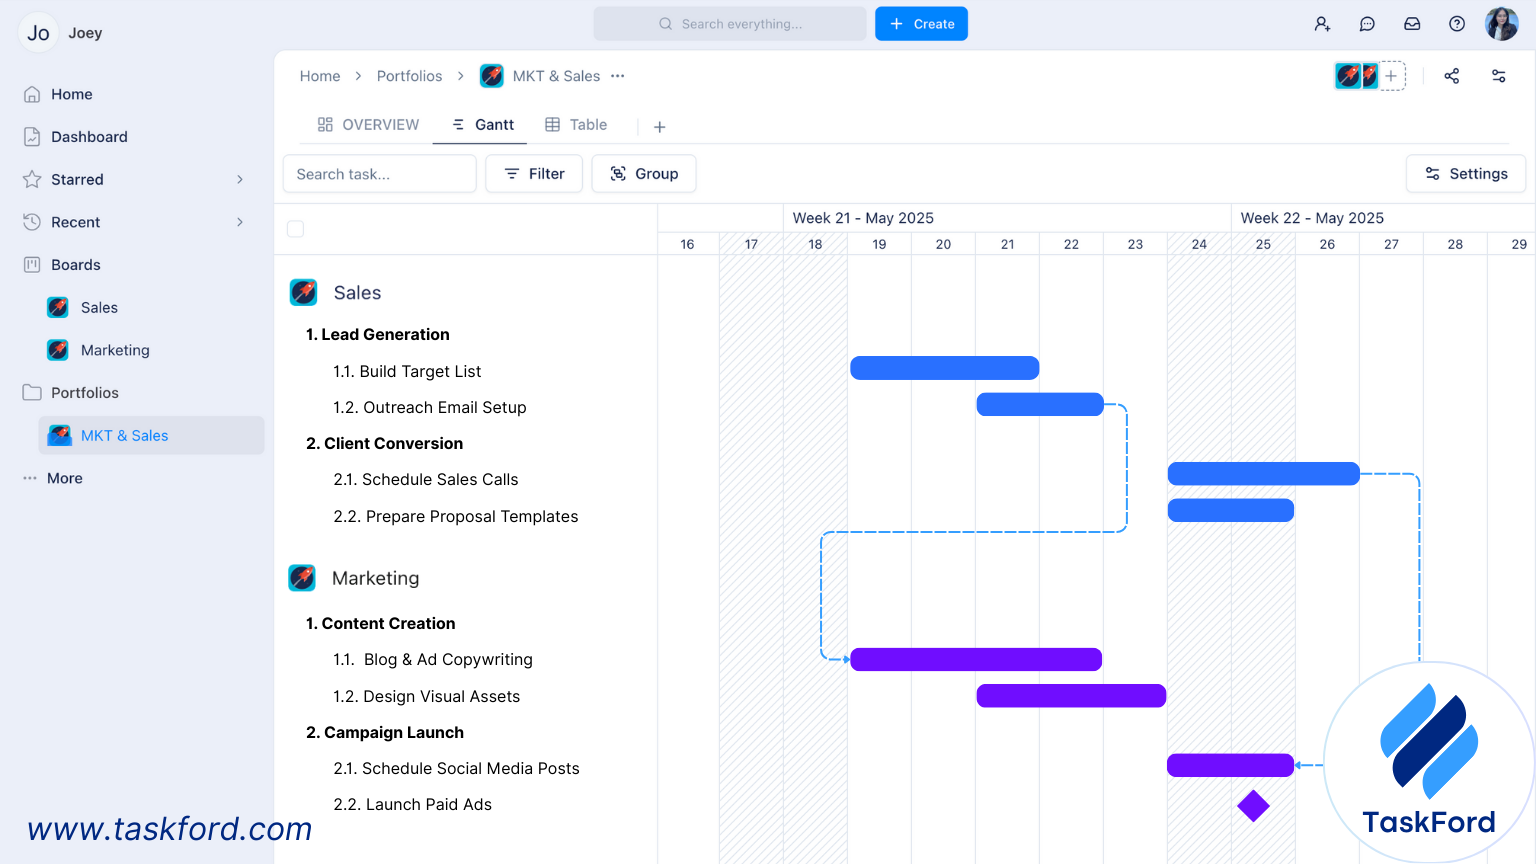
On the right, the Gantt view shows:
- Parallel Timelines: Tasks from both Sales and Marketing projects are scheduled over the same two-week period, allowing for direct comparison and coordination.
- Task Dependencies: Dashed lines connect related tasks across projects—for example, Marketing’s “Launch Paid Ads” depends on earlier Sales activities. This helps teams anticipate delays and align deliverables.
- Milestone Markers: A milestone icon indicates a key event, such as a campaign launch or major handoff, providing a visual checkpoint for progress tracking.
- Color-Coded Bars: Tasks are color-coded by project for quick visual distinction between workstreams.
- Grouped Portfolios: Both Sales and Marketing are grouped under the “MKT & Sales” portfolio, making it easy to manage initiatives that contribute to shared business outcomes.
This view gives project managers a unified timeline, improves cross-functional planning, and helps stakeholders track the status of multiple projects in one place. TaskFord’s Gantt capabilities reduce manual overhead while offering real-time updates, making it easier to maintain alignment and drive execution.
Final Thoughts
Managing multiple projects without a clear visual structure can lead to missed deadlines, resource conflicts, and misaligned teams. A Gantt chart for multiple projects solves this by providing a centralized, real-time view of every initiative in flight. From grouping projects into portfolios to defining dependencies and tracking milestones, each step in the Gantt process helps bring order to complexity.
Whether you’re overseeing two projects or twenty, tools like TaskFord make it easier to plan, monitor, and adjust, without the manual overhead. With built-in features for cross-project visibility, workload balancing, and collaborative updates, TaskFord turns your Gantt chart into a living system that drives execution.
Looking for a broader foundation in project planning? Visit our Project Management Guide for practical frameworks and expert tips to strengthen your overall project management approach.
Related Articles














How to Build and Manage a Product Roadmap with TaskFord












How to Build a Connected Project Timeline in TaskFord








What Are the Best Jira Alternatives for Scrum Teams?





















How WBS Reveals Delivery Breakdown Before It’s Too Late








![How To Conduct a Profound Stakeholder Analysis [+ Free Template]](/marketing/blog/stakeholder-analysis.webp)
















What to Look for in Scrum Tools (Beyond Kanban Boards)

![Project Management Calendar for Teams and Managers [Free Templates]](/marketing/blog/project-management-calendar.webp)







How to Define Project Deliverables: A Step-by-Step Guide









![RACI Chart in Project Management: Rules & Examples [Free Download]](/marketing/blog/raci-chart.webp)

















![7 Must-Have Project Management Documents Every PO Should Know [Free Templates]](/marketing/blog/project-management-documents.webp)










![How to Create a Winning Project Plan for IT Projects [10 Steps Included]](/marketing/blog/how-to-create-a-project-plan.webp)


![Daily Standup Best Practices: Apply AI to Organize Meetings Successfully [2026 Trends]](/marketing/blog/daily-standup.webp)






![How to Create a Project Communication Plan: Step-by-Step Guide [+Free Template]](/marketing/blog/project-communication-plan.png)


![Master Project Procurement Management in 5 Steps [Download a free plan template]](/marketing/blog/project-procurement-management.webp)





























Subscribe for Expert Tips
Unlock expert insights and stay ahead with TaskFord. Sign up now to receive valuable tips, strategies, and updates directly in your inbox.