Productivity Planning with Gantt Charts: Visualizing Workload and Deadlines
Productivity planning with Gantt charts helps visualize workloads, deadlines, and dependencies for better resource management and project success.
Imagine that your team’s calendar is full, every resource looks allocated, and on paper, the project should be on track. Yet deadlines are still slipping, people feel overloaded, and productivity isn’t where it should be. The problem? You’re planning capacity, but not productivity planning.
This is where Gantt charts become more than just a scheduling tool. They act like a project “x-ray,” letting you see beyond who is assigned to what and into how work is actually progressing — where bottlenecks form, when workloads are unbalanced, and how deadlines align with reality.
In this blog, we’ll break down how Gantt charts bring productivity planning and resource planning together, why visualization is the key to spotting issues early, and the steps you can take to build a plan that turns busy schedules into meaningful results.
What is Productivity Planning (and How It Differs from Resource Planning)
Productivity planning is about making sure work is not only assigned, but also realistic and achievable. It focuses on efficiency, prioritization, and outcomes — in other words, how effectively the team can complete the work within the given time.
Resource planning, on the other hand, is about availability and allocation. It answers questions like Who is available? When can they work? What skills do they bring?
The two go hand in hand:
- Resource planning ensures the right people are assigned.
- Productivity planning ensures the workload is balanced and deadlines are achievable.
Without productivity planning, projects risk being “fully resourced” on paper but still falling behind in practice.
👉 Want to dig deeper into resource allocation before productivity planning kicks in? Check out our full guide: What is Resource Planning?
Why Productivity Planning Needs Visualization
When teams talk about productivity planning, they often focus on assigning tasks and setting deadlines. But without visualization, it’s difficult to see how everything actually fits together. A task list might tell you what needs to be done, but it won’t show when work overlaps, where dependencies create risks, or whether someone’s workload is already at capacity.
This lack of visibility leads to common problems in projects:
- Overbooking or underutilization → some people carry too much, while others aren’t fully engaged.
- Missed deadlines → hidden dependencies cause delays that ripple through the project.
- Invisible bottlenecks → small issues pile up until they slow the whole team down.
- Poor prioritization → teams end up working on the “urgent” instead of the “important.”
Visualization changes that. By laying out tasks, deadlines, and workloads in a timeline view, productivity planning becomes more than just scheduling — it becomes a way to see the full picture of how work moves across the team. Managers can spot risks early, rebalance workloads, and check whether the plan is realistic. Team members can see where their work fits into the bigger picture, which helps with focus and accountability.
Thus, visualization brings clarity. It turns productivity planning from an abstract process into something tangible and actionable, helping both managers and stakeholders make better decisions about time, capacity, and priorities.
How Gantt Charts Make Productivity Planning Work
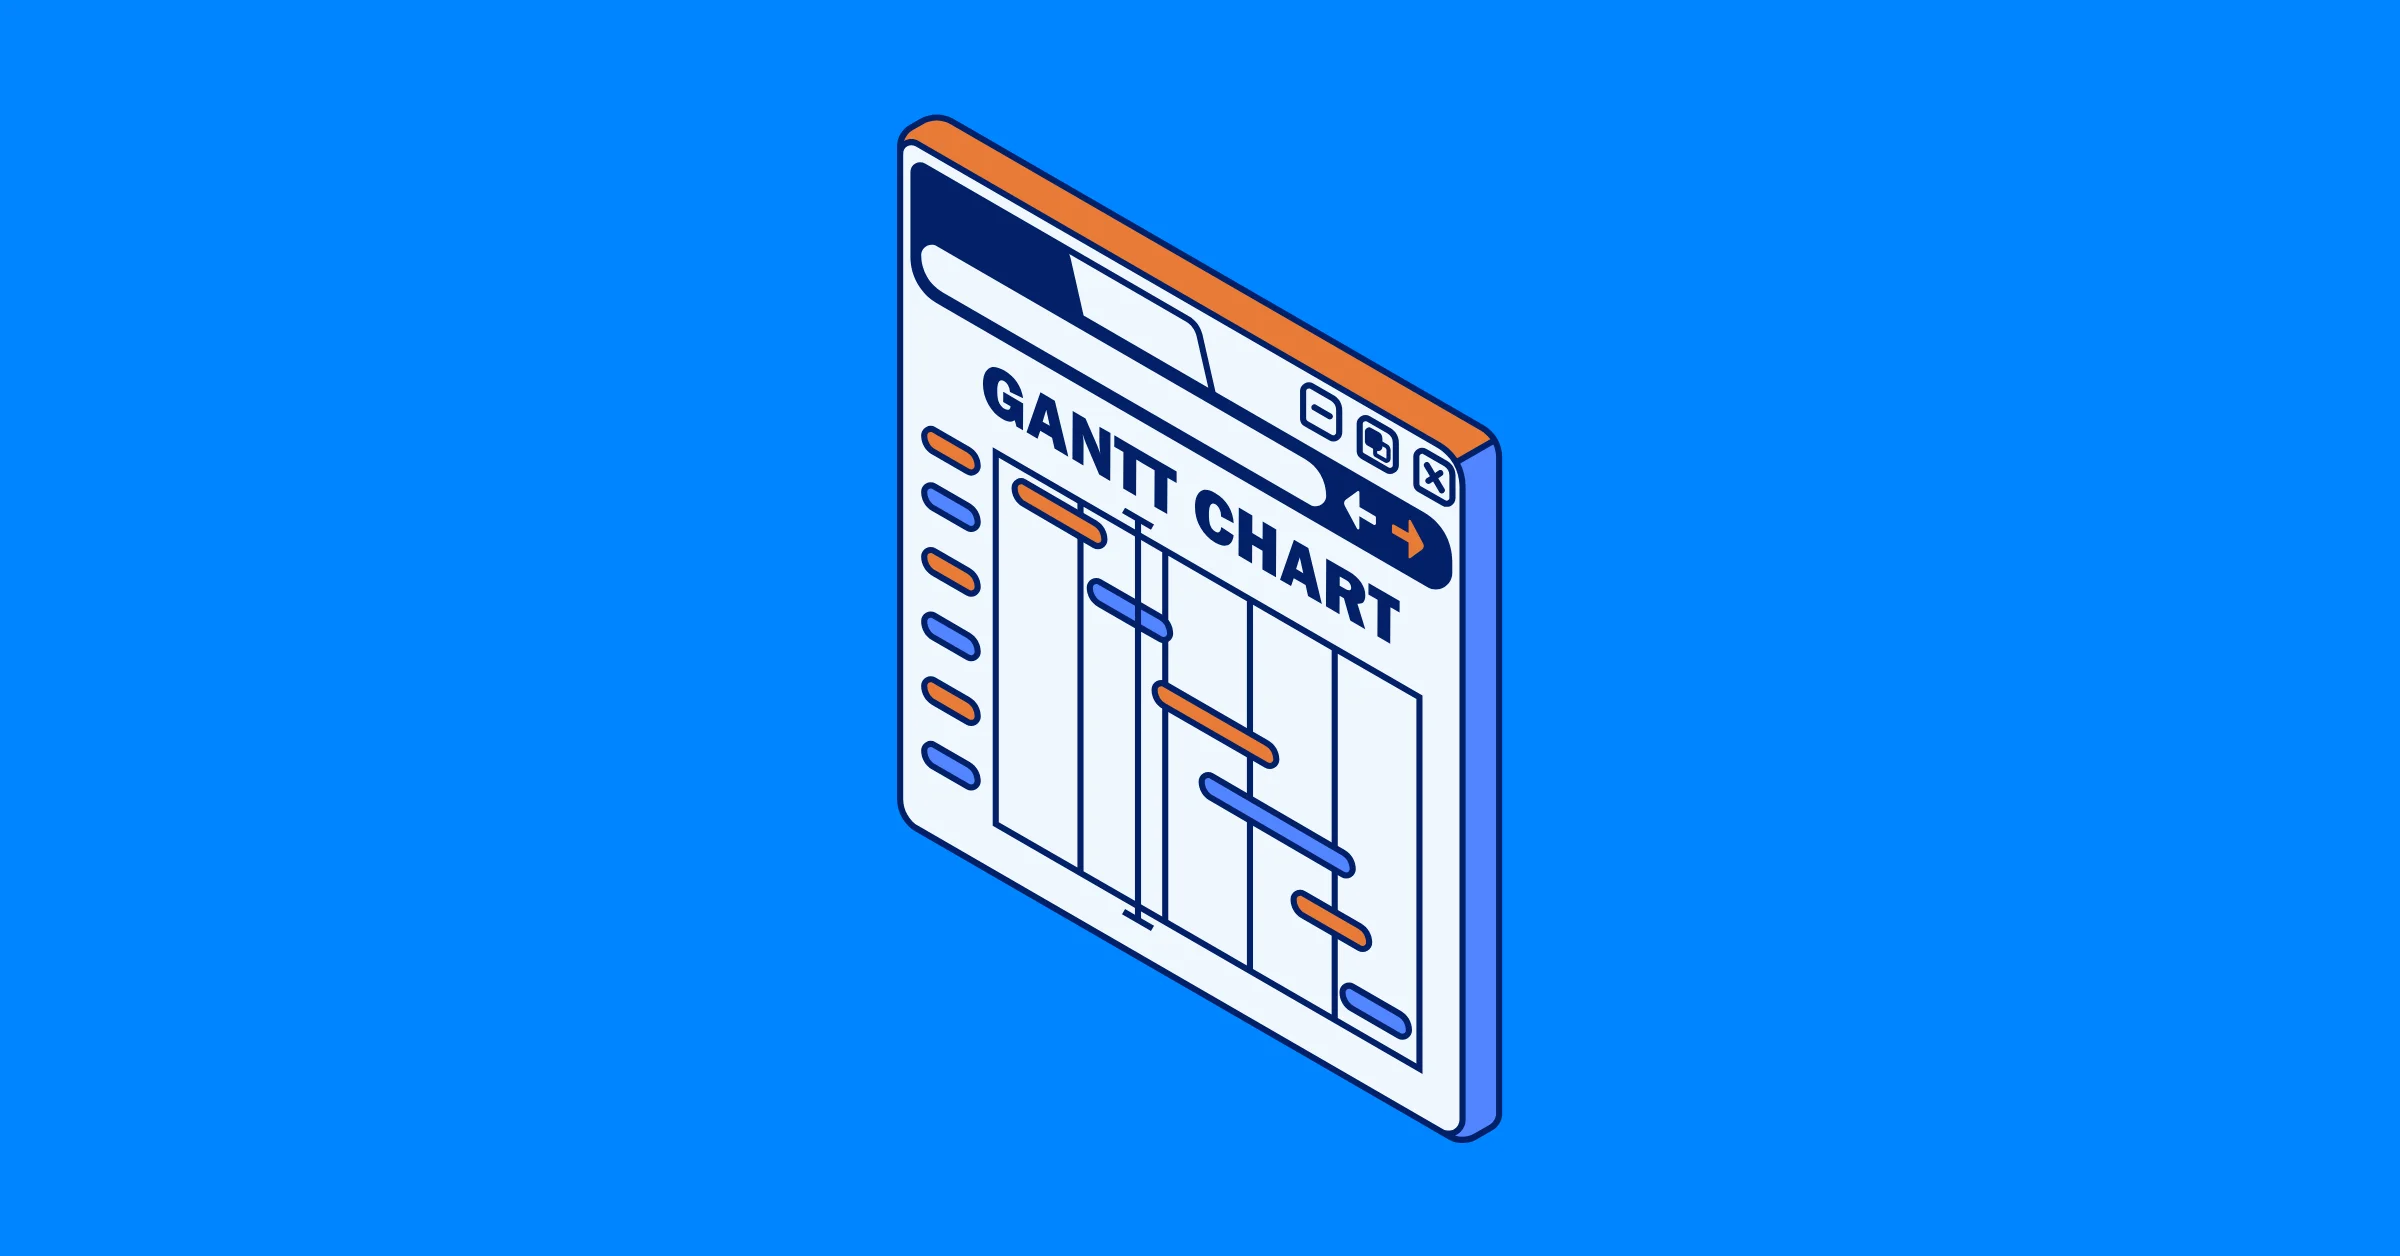
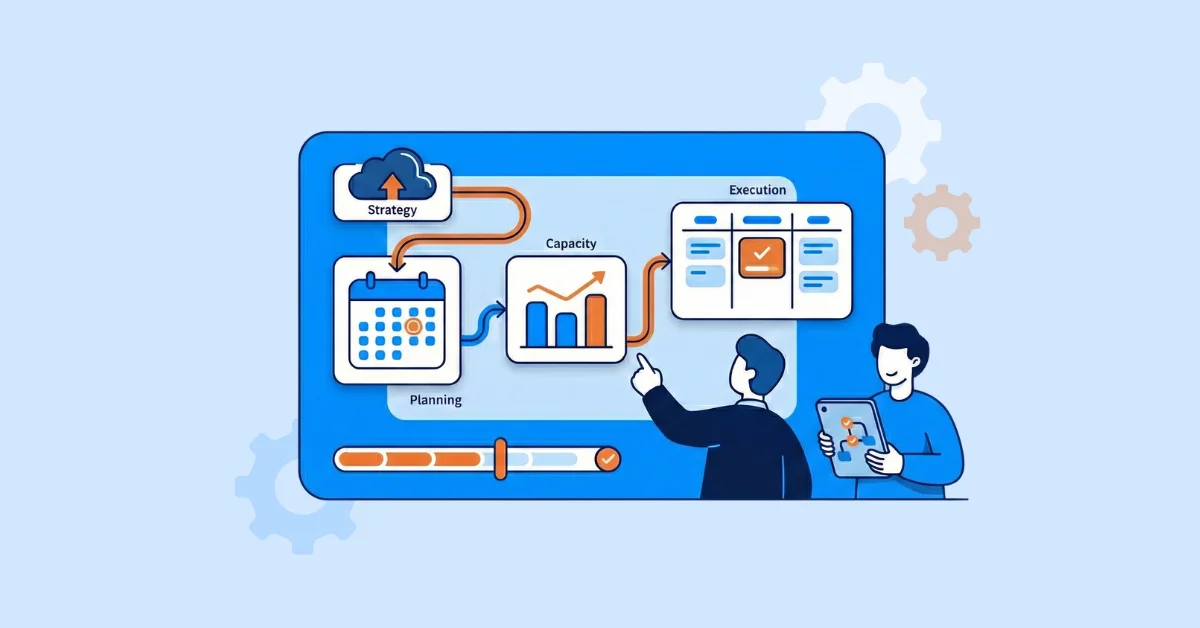
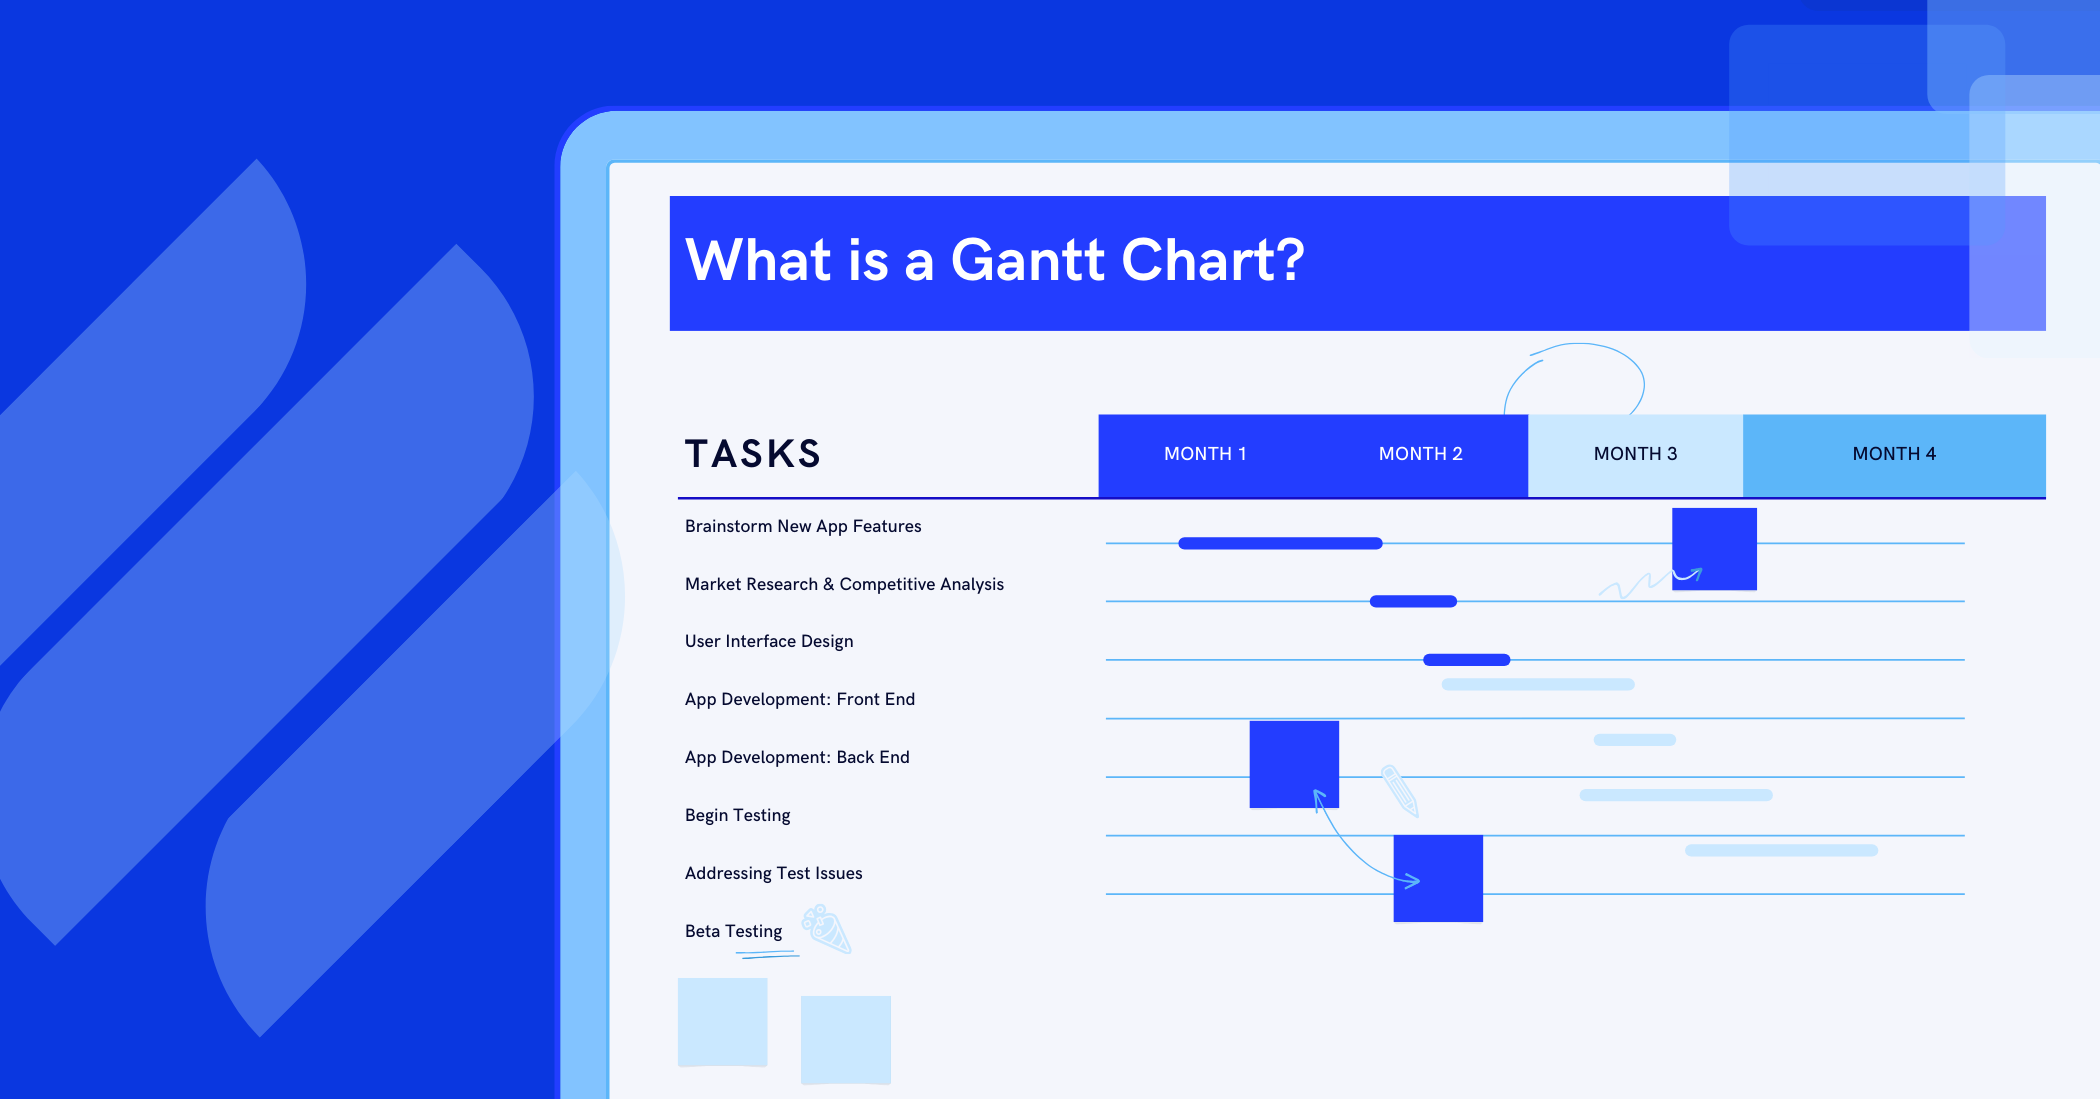
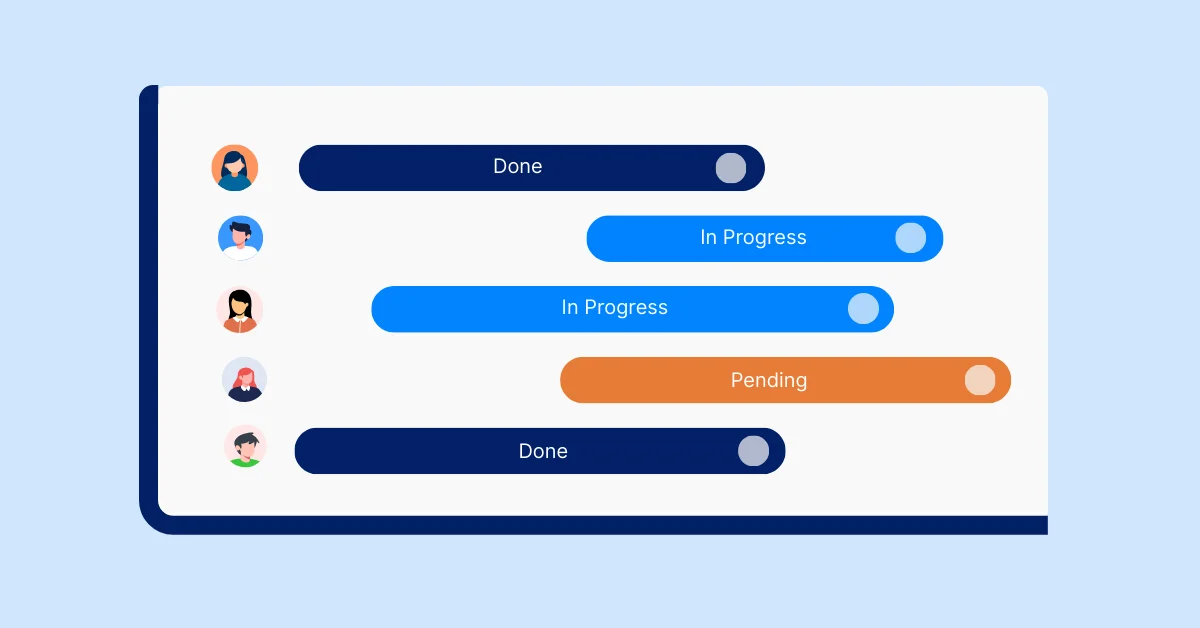
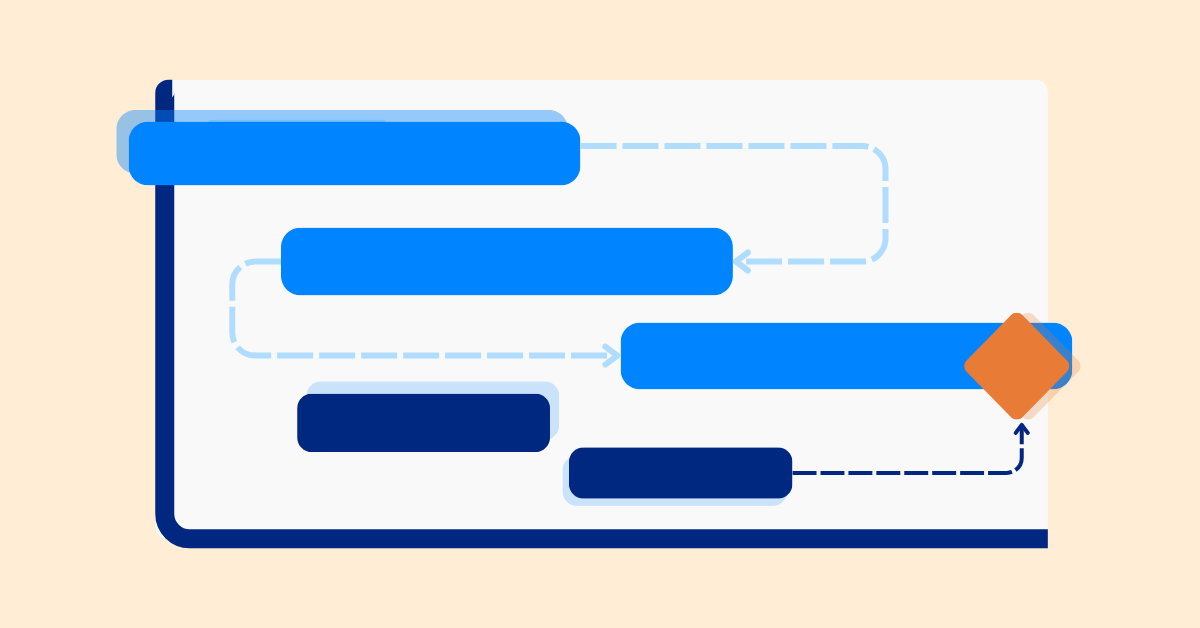
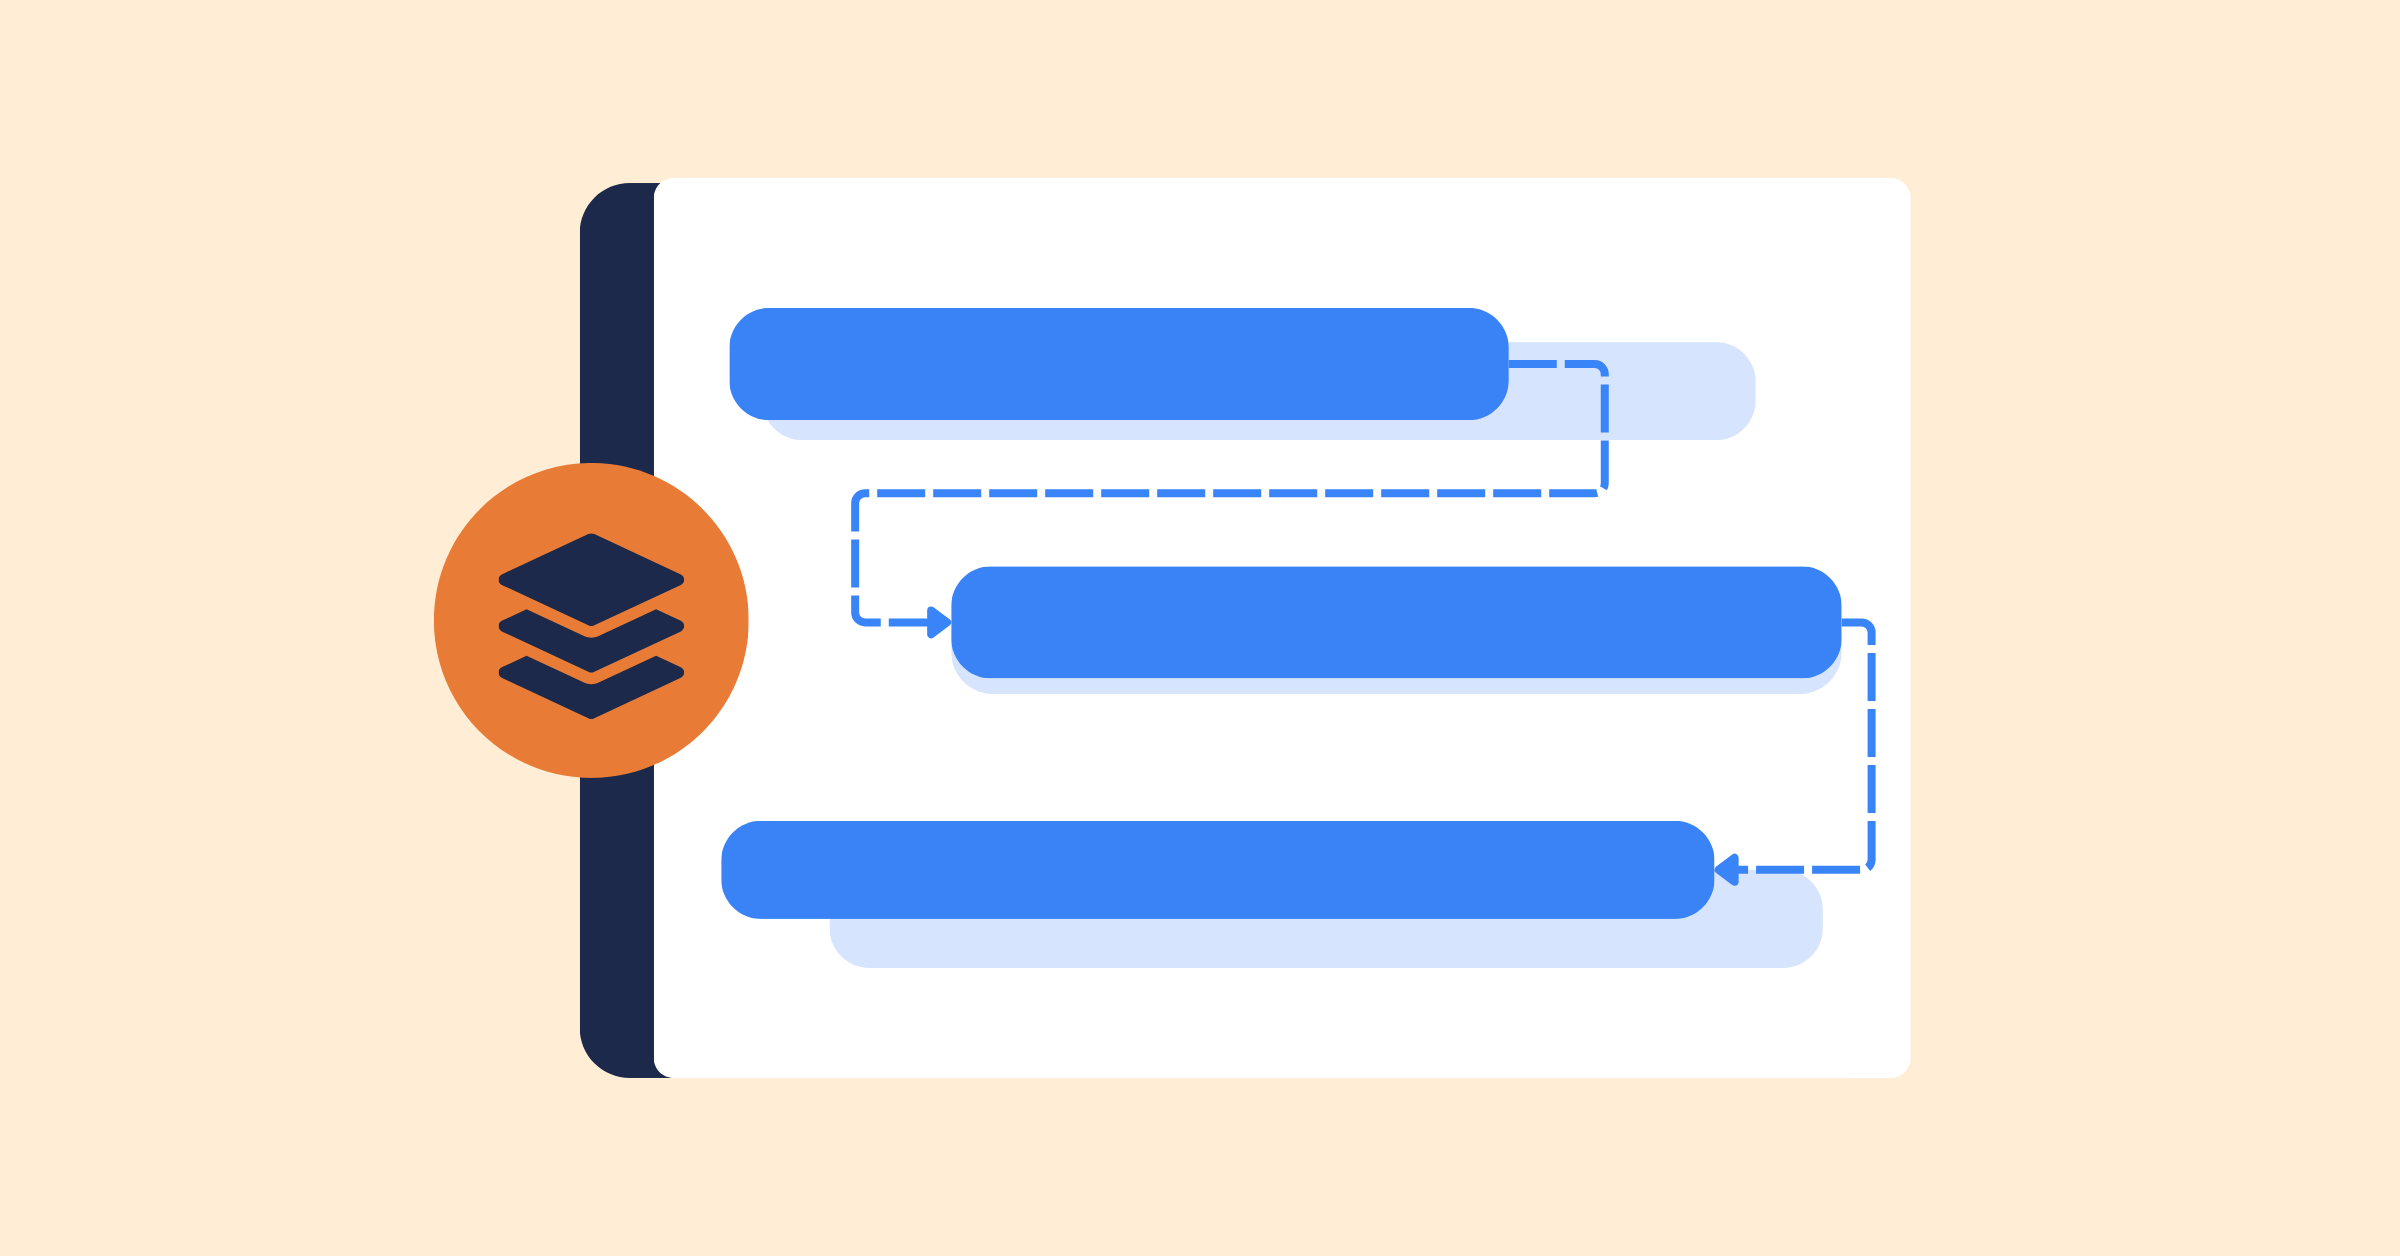
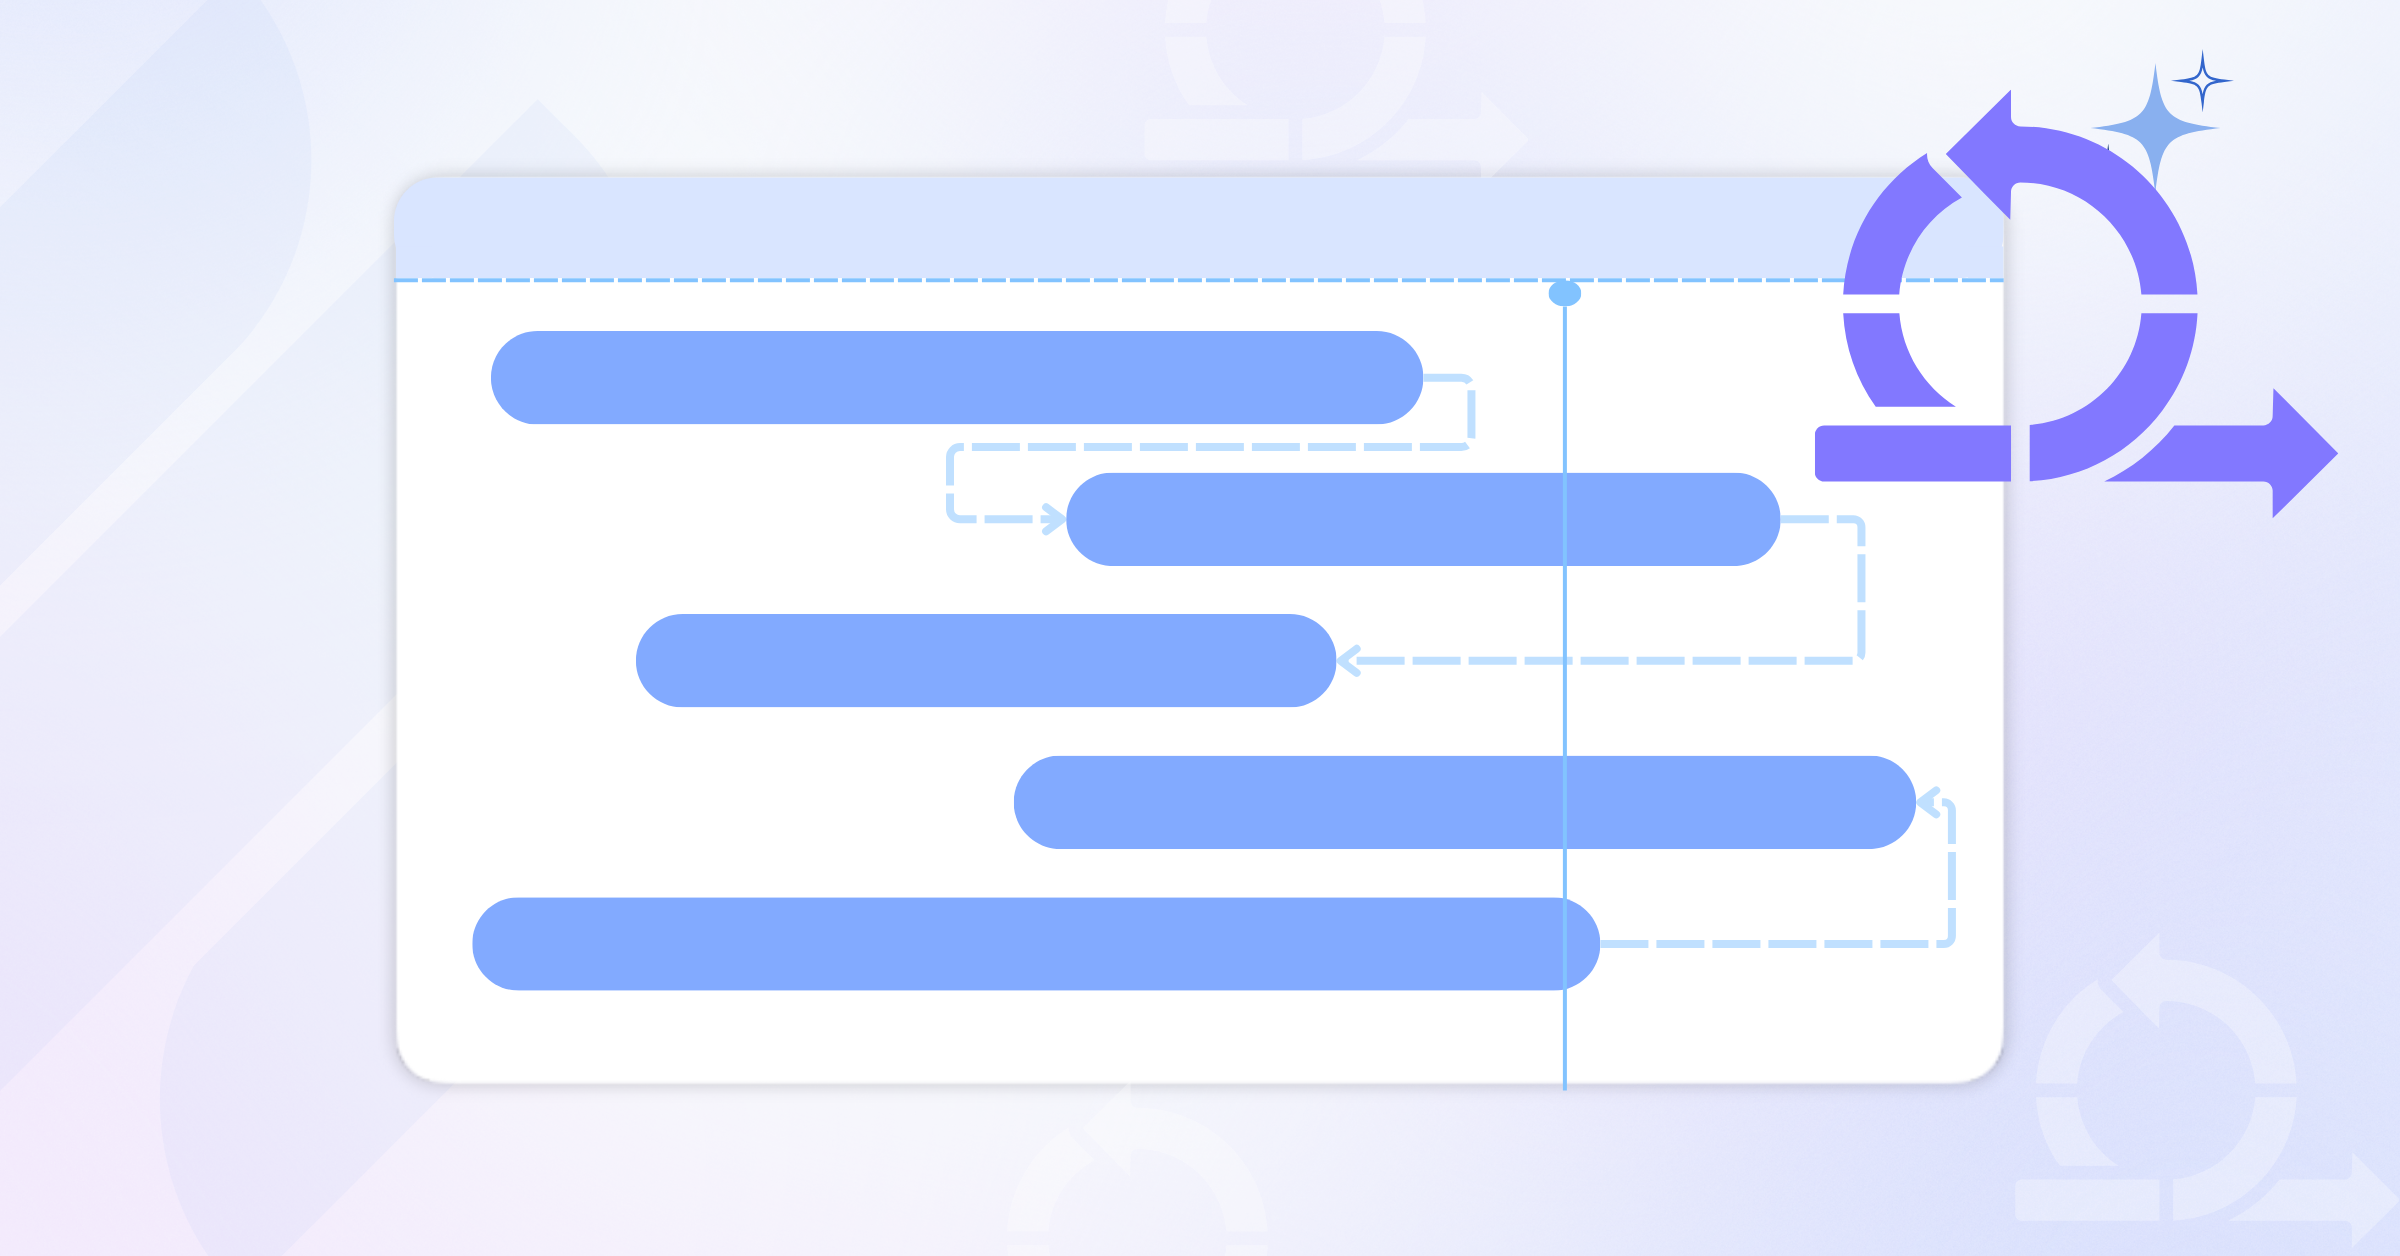
Gantt charts are one of the most effective tools for turning productivity planning into something visible and practical. Instead of juggling spreadsheets or long to-do lists, a Gantt chart gives you a timeline view of the entire project — showing what needs to be done, who’s responsible, and when the work is due.
👉 Not familiar with how Gantt charts work? Check out our guide: what is a Gantt Chart?
Here’s how Gantt charts support productivity planning:
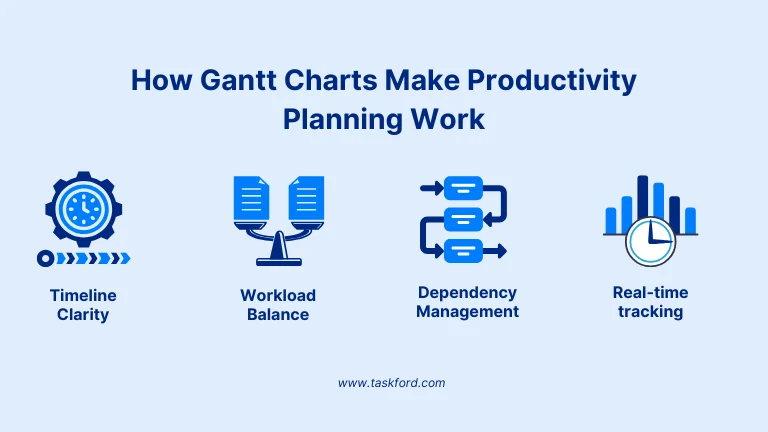
- Timeline clarity Every task, project milestones, and deadline is displayed in sequence. This makes it easy to see how individual tasks connect, where overlaps occur, and whether the schedule is realistic.
- Workload balance Gantt charts highlight how resources are spread across projects. If someone has too many tasks stacked together, or too few, you can spot it instantly and adjust before it becomes a problem.
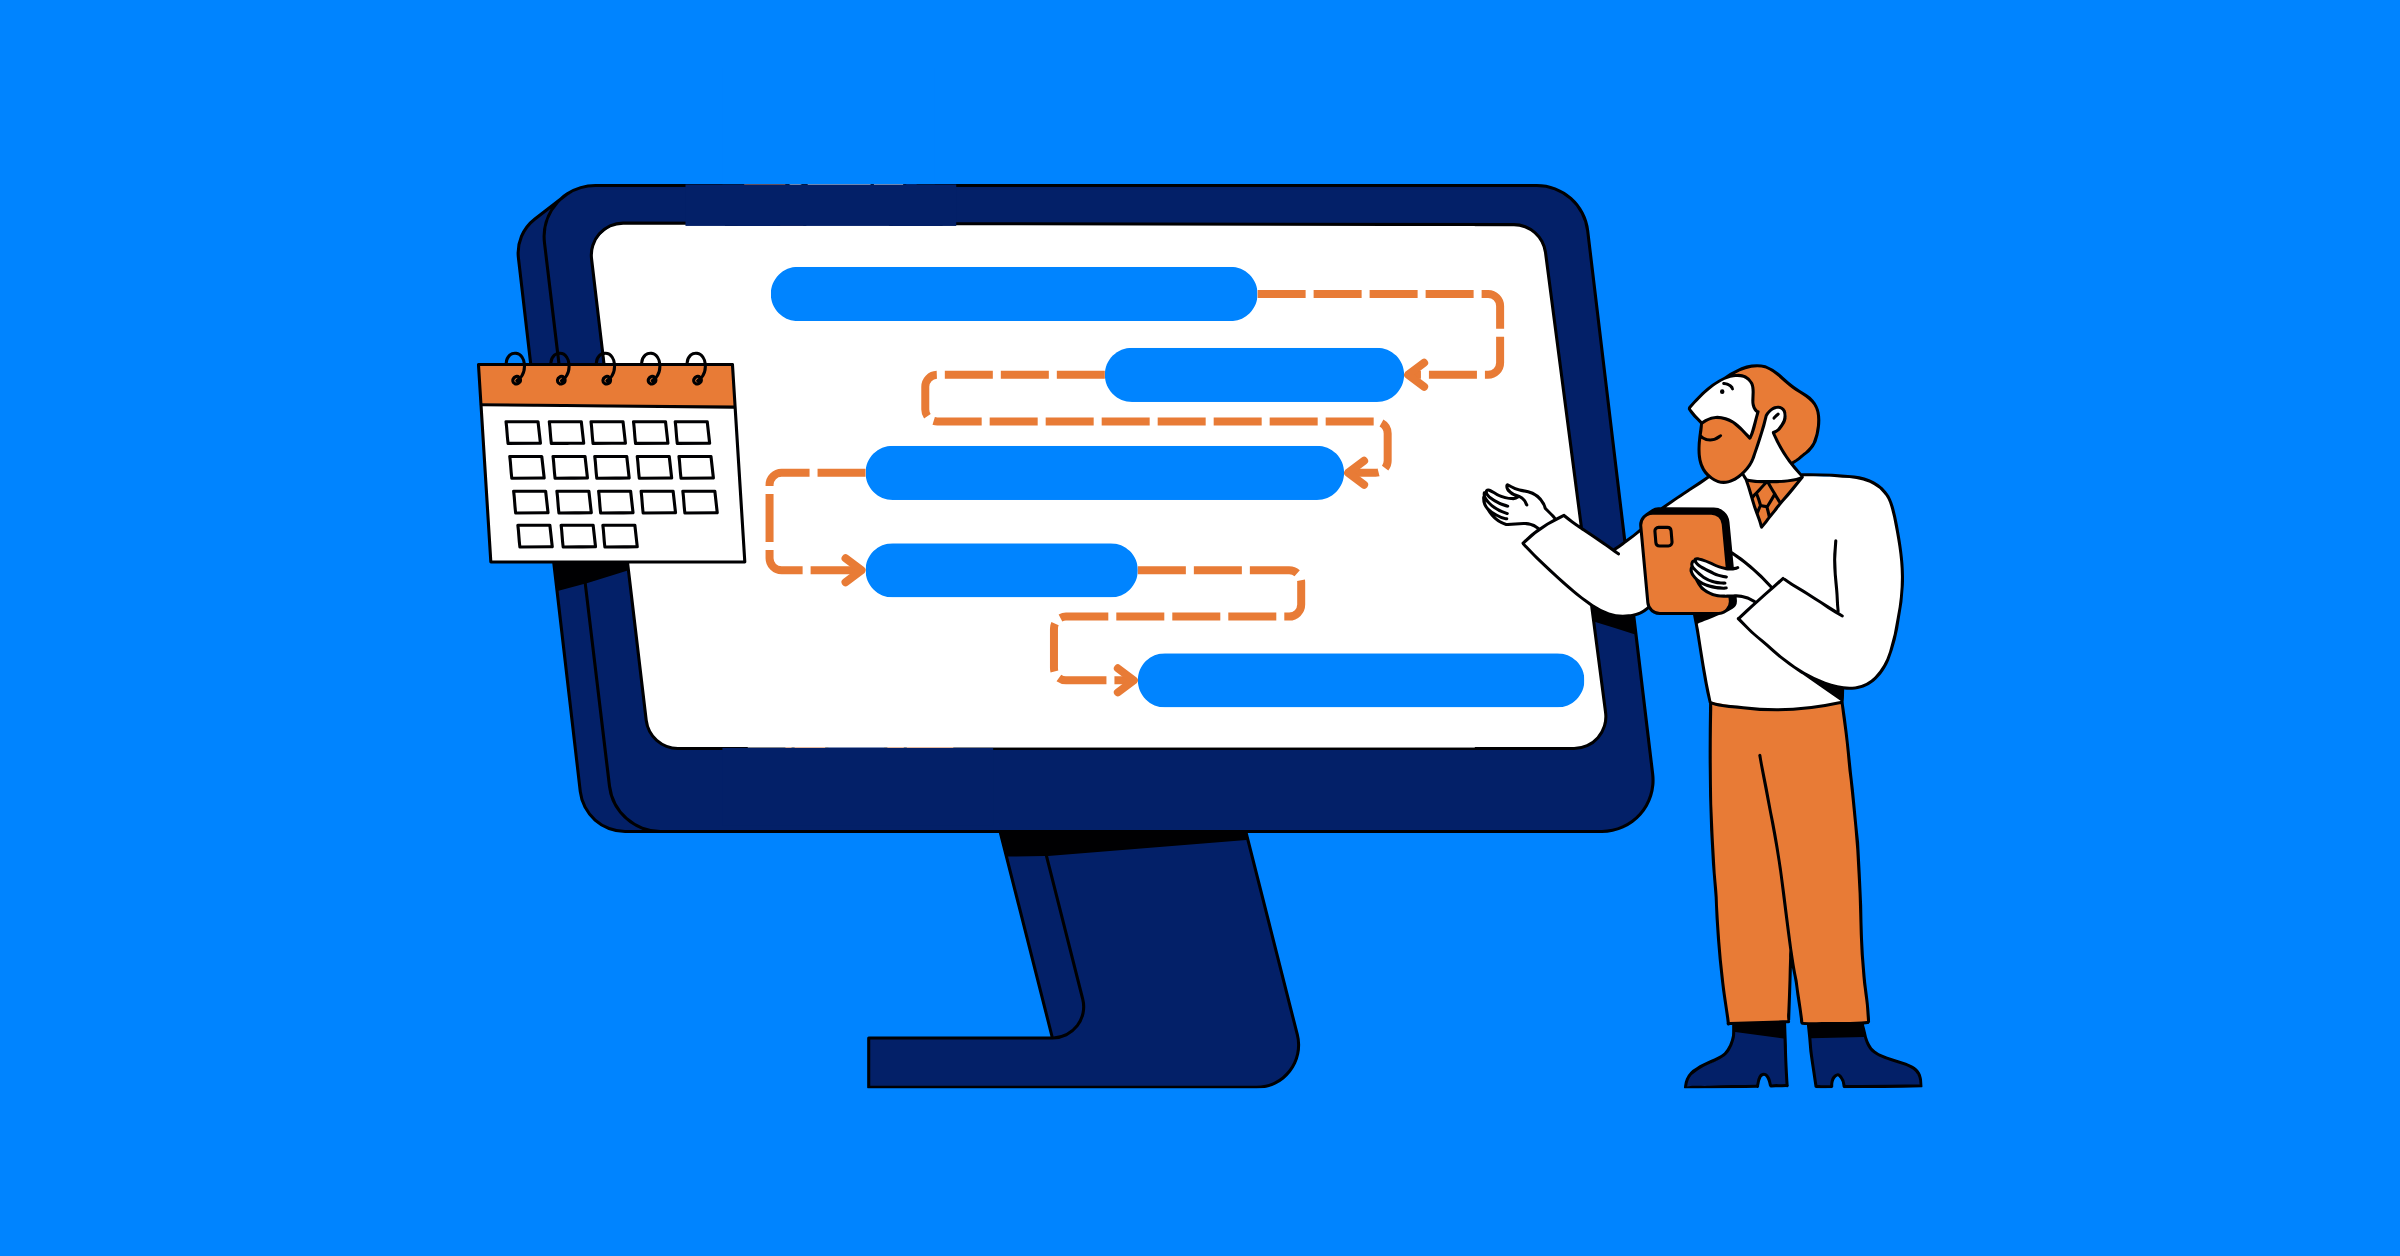
- Dependency management Many delays happen because one task can’t begin until another is finished. A Gantt chart makes these dependencies visible, so managers can plan around them and prevent bottlenecks.
- Real-time tracking Modern Gantt chart tools update as tasks are completed. This helps managers compare progress against the plan and adjust workloads or deadlines when productivity slows down.
By combining all of these, Gantt acts as the bridge between resource allocation and productivity planning. They don’t just show who is working, but also how effectively the work is moving toward deadlines.
Practical Steps to Build a Productivity Plan with Gantt Charts
Turning productivity planning into action doesn’t have to be complicated. A Gantt chart provides a clear structure for mapping out tasks, timelines, and workloads in a way that’s easy to follow. Here’s a simple process you can use:
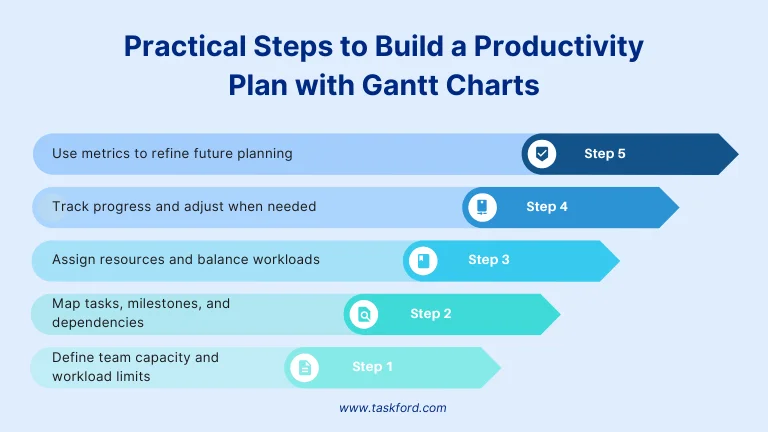
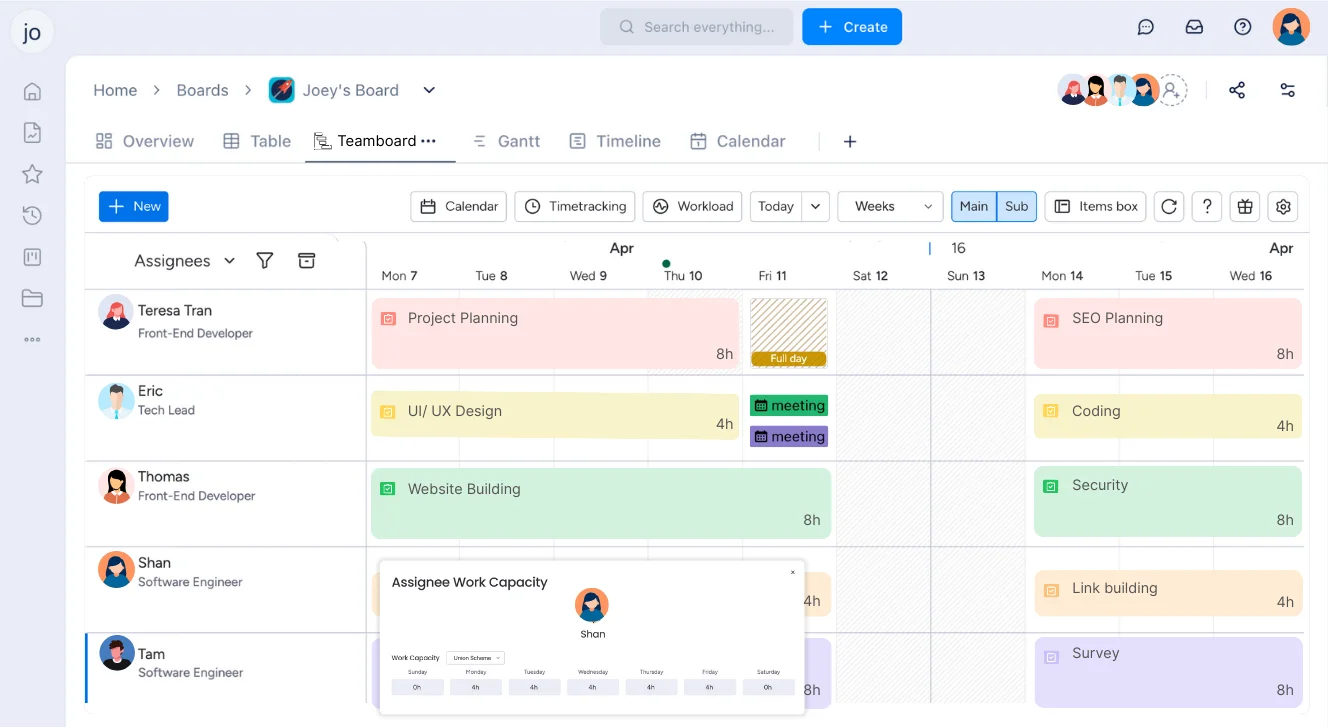
Step 1: Define team capacity and workload limits
Before anything goes on a chart, understand what your team can realistically handle. Look at available hours, ongoing commitments, and individual strengths. This capacity baseline prevents over-allocation and makes productivity planning grounded in reality rather than assumptions.
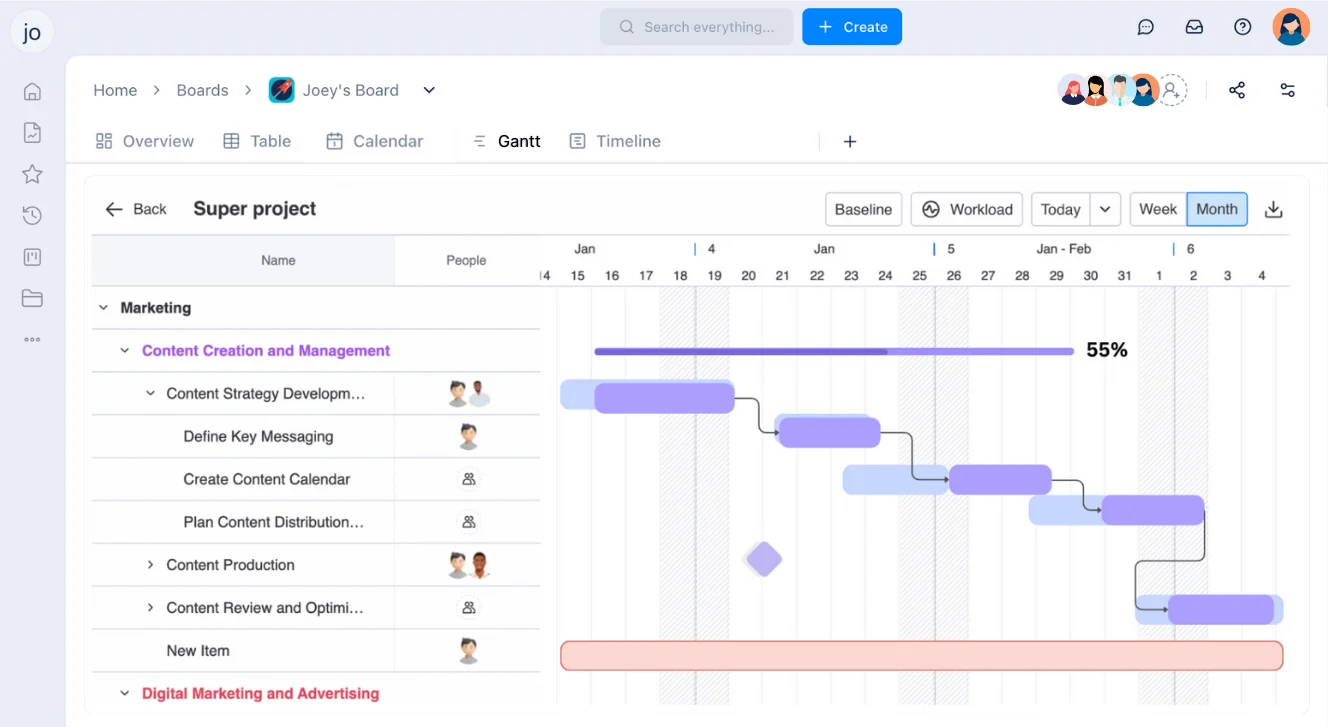
Step 2: Map tasks, milestones, and dependencies
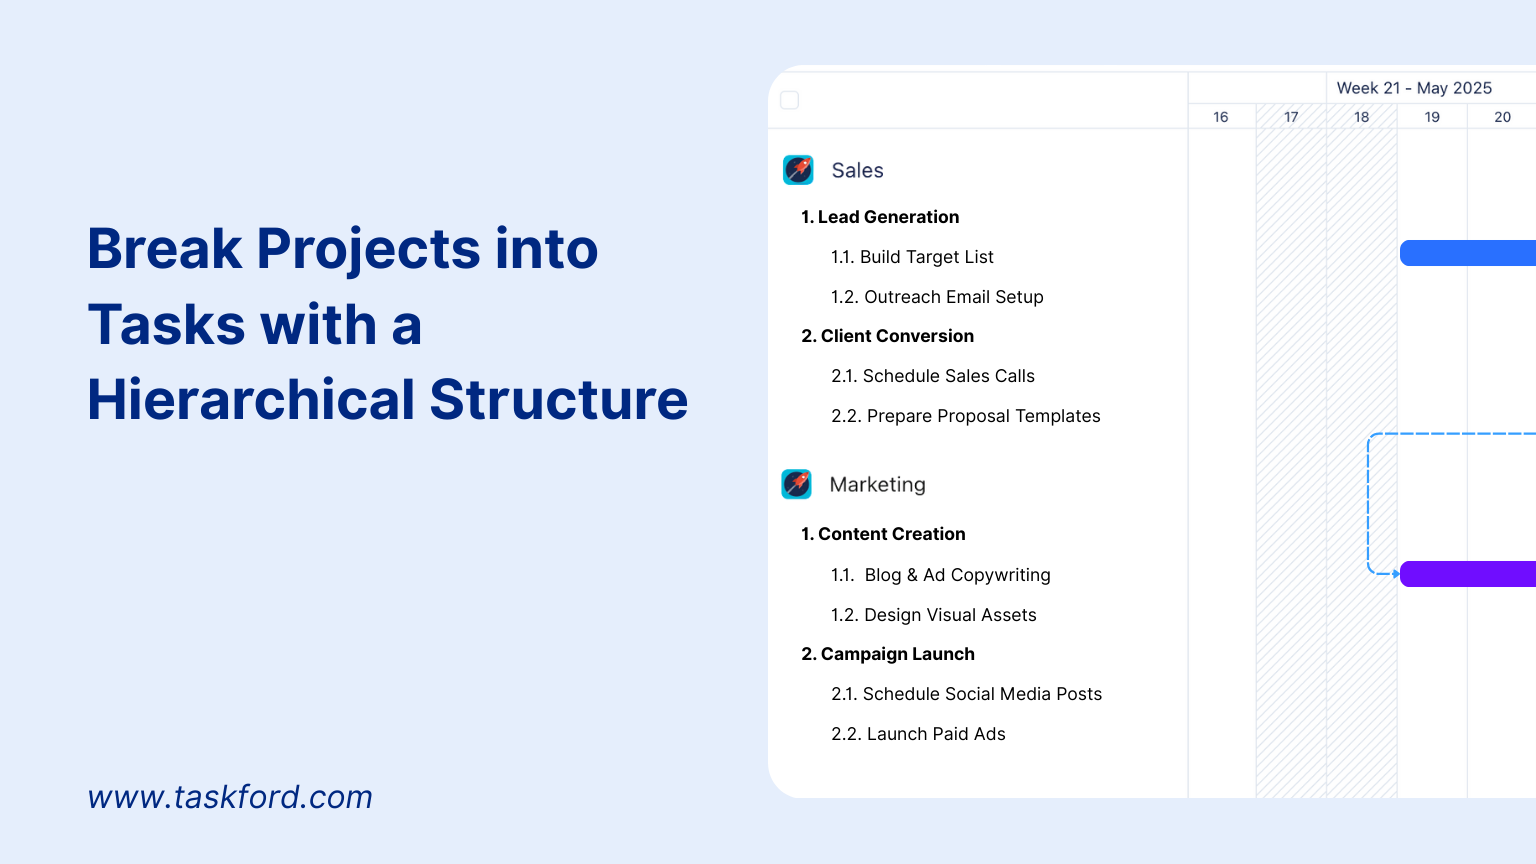
Break the project into smaller, manageable tasks. Add milestone for key deliverables and mark dependencies so you know which tasks rely on others to be completed first. In a Gantt chart, these connections make it easy to see where delays in one task could impact the rest of the project.
Step 3: Assign resources and balance workloads
Now, link tasks to the right people. The visual layout of a Gantt chart shows immediately if someone has been given too much or too little. Adjusting assignments at this stage helps avoid burnout for some team members and disengagement for others.
Step 4: Track progress and adjust when needed
A productivity plan isn’t static. As the project progresses, update the Gantt chart to reflect actual progress. If tasks take longer than expected, or priorities shift, you can adjust workloads and deadlines in real time. This flexibility keeps productivity planning aligned with actual project conditions.
Step 5: Use metrics to refine future planning
Finally, measure how well the plan worked. Look at task completion rates, deadline variance, and overall project delivery. These productivity metrics provide feedback you can use to improve future planning and make Gantt charts an even stronger tool over time.
Best Practices for Productivity Planning with Gantt Charts
A Gantt chart is only as useful as the way you use it. To get the most value for productivity planning, project managers and teams should follow some best practices that keep plans realistic and easy to manage:
1. Avoid planning at 100% capacity
It might seem efficient to fill every available hour on the Gantt chart, but doing so leaves no room for unforeseen delays, context switching, or additional work. Instead, aim to plan around 70-80% capacity to account for unexpected tasks, ensure workloads remain sustainable, and prevent team burnout.
2. Keep the chart up to date
A Gantt chart is a living document, not a one-time snapshot. As tasks are completed, priorities shift, or delays happen, it’s crucial to update the chart regularly. An outdated Gantt chart quickly becomes irrelevant and loses its value in productivity planning. Always keep your chart aligned with the project’s current status to track real-time progress.
3. Use Color Coding and Workload Views
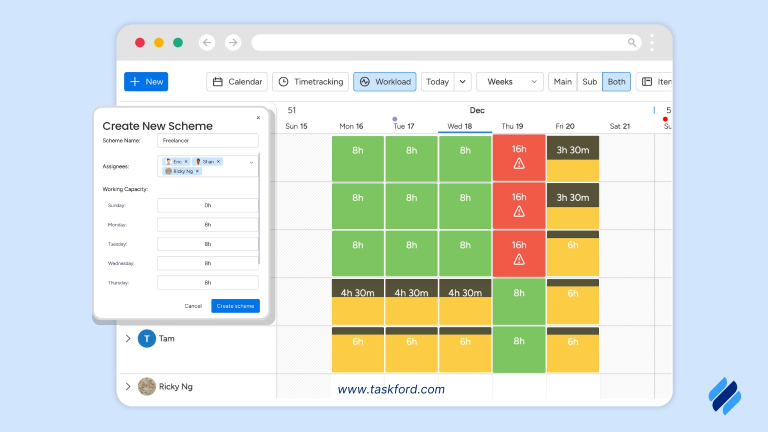
Visual cues such as color coding, workload heatmaps, or progress bars can make it easier to identify potential risks and bottlenecks at a glance. Whether it’s a missed deadline, an overloaded team member, or a delay, these visual indicators help project managers react quickly and adjust workloads or timelines accordingly.
4. Connect tasks to outcomes, not just deadlines
Productivity planning isn’t just about finishing tasks; it’s about delivering value. Link tasks to milestones, KPIs, or OKRs so you can track whether completed work is contributing to overall project goals.
5. Break down large tasks into smaller steps
Big tasks can seem overwhelming and may mask progress (or lack of it). Breaking them into smaller, manageable activities allows you to track work more effectively, identify potential delays sooner, and keep team members accountable. This also makes it easier to stay on schedule without overburdening any one person or team.
6. Communicate regularly using the chart
A Gantt chart should be a collaboration tool, not just a project management tool. Share it regularly with the team during daily stand-ups or weekly check-ins to ensure everyone is aligned on the project’s progress. This transparency helps team members understand their roles within the bigger picture and adjust their work as necessary.
7. Review and learn after each project
Once a project is completed, take the time to review your Gantt chart. Did the original timelines align with actual progress? Were workloads accurately planned? Reflecting on these questions will help you improve your planning process for future projects, ensuring more realistic timelines, better resource management, and overall project success.
By following these best practices, you’ll ensure that your Gantt charts not only keep you organized but also serve as a strategic tool for driving efficiency, enhancing team collaboration, and delivering successful projects on time.
Conclusion
At its core, productivity planning is about making sure work is not only assigned but also achievable. Gantt charts make this process clearer by showing how tasks, deadlines, and workloads fit together in real time. They help managers balance resources, spot risks early, and keep teams focused on realistic goals instead of overloaded schedules.
When combined with resource planning, Gantt charts give project managers and stakeholders a complete picture: who is available, what they’re working on, and how effectively the work is progressing. It’s this balance of capacity and productivity that turns project plans into successful outcomes.
Related Resources
- Enterprise Resource Planning: Explore its types and differences. Discover top ERP apps
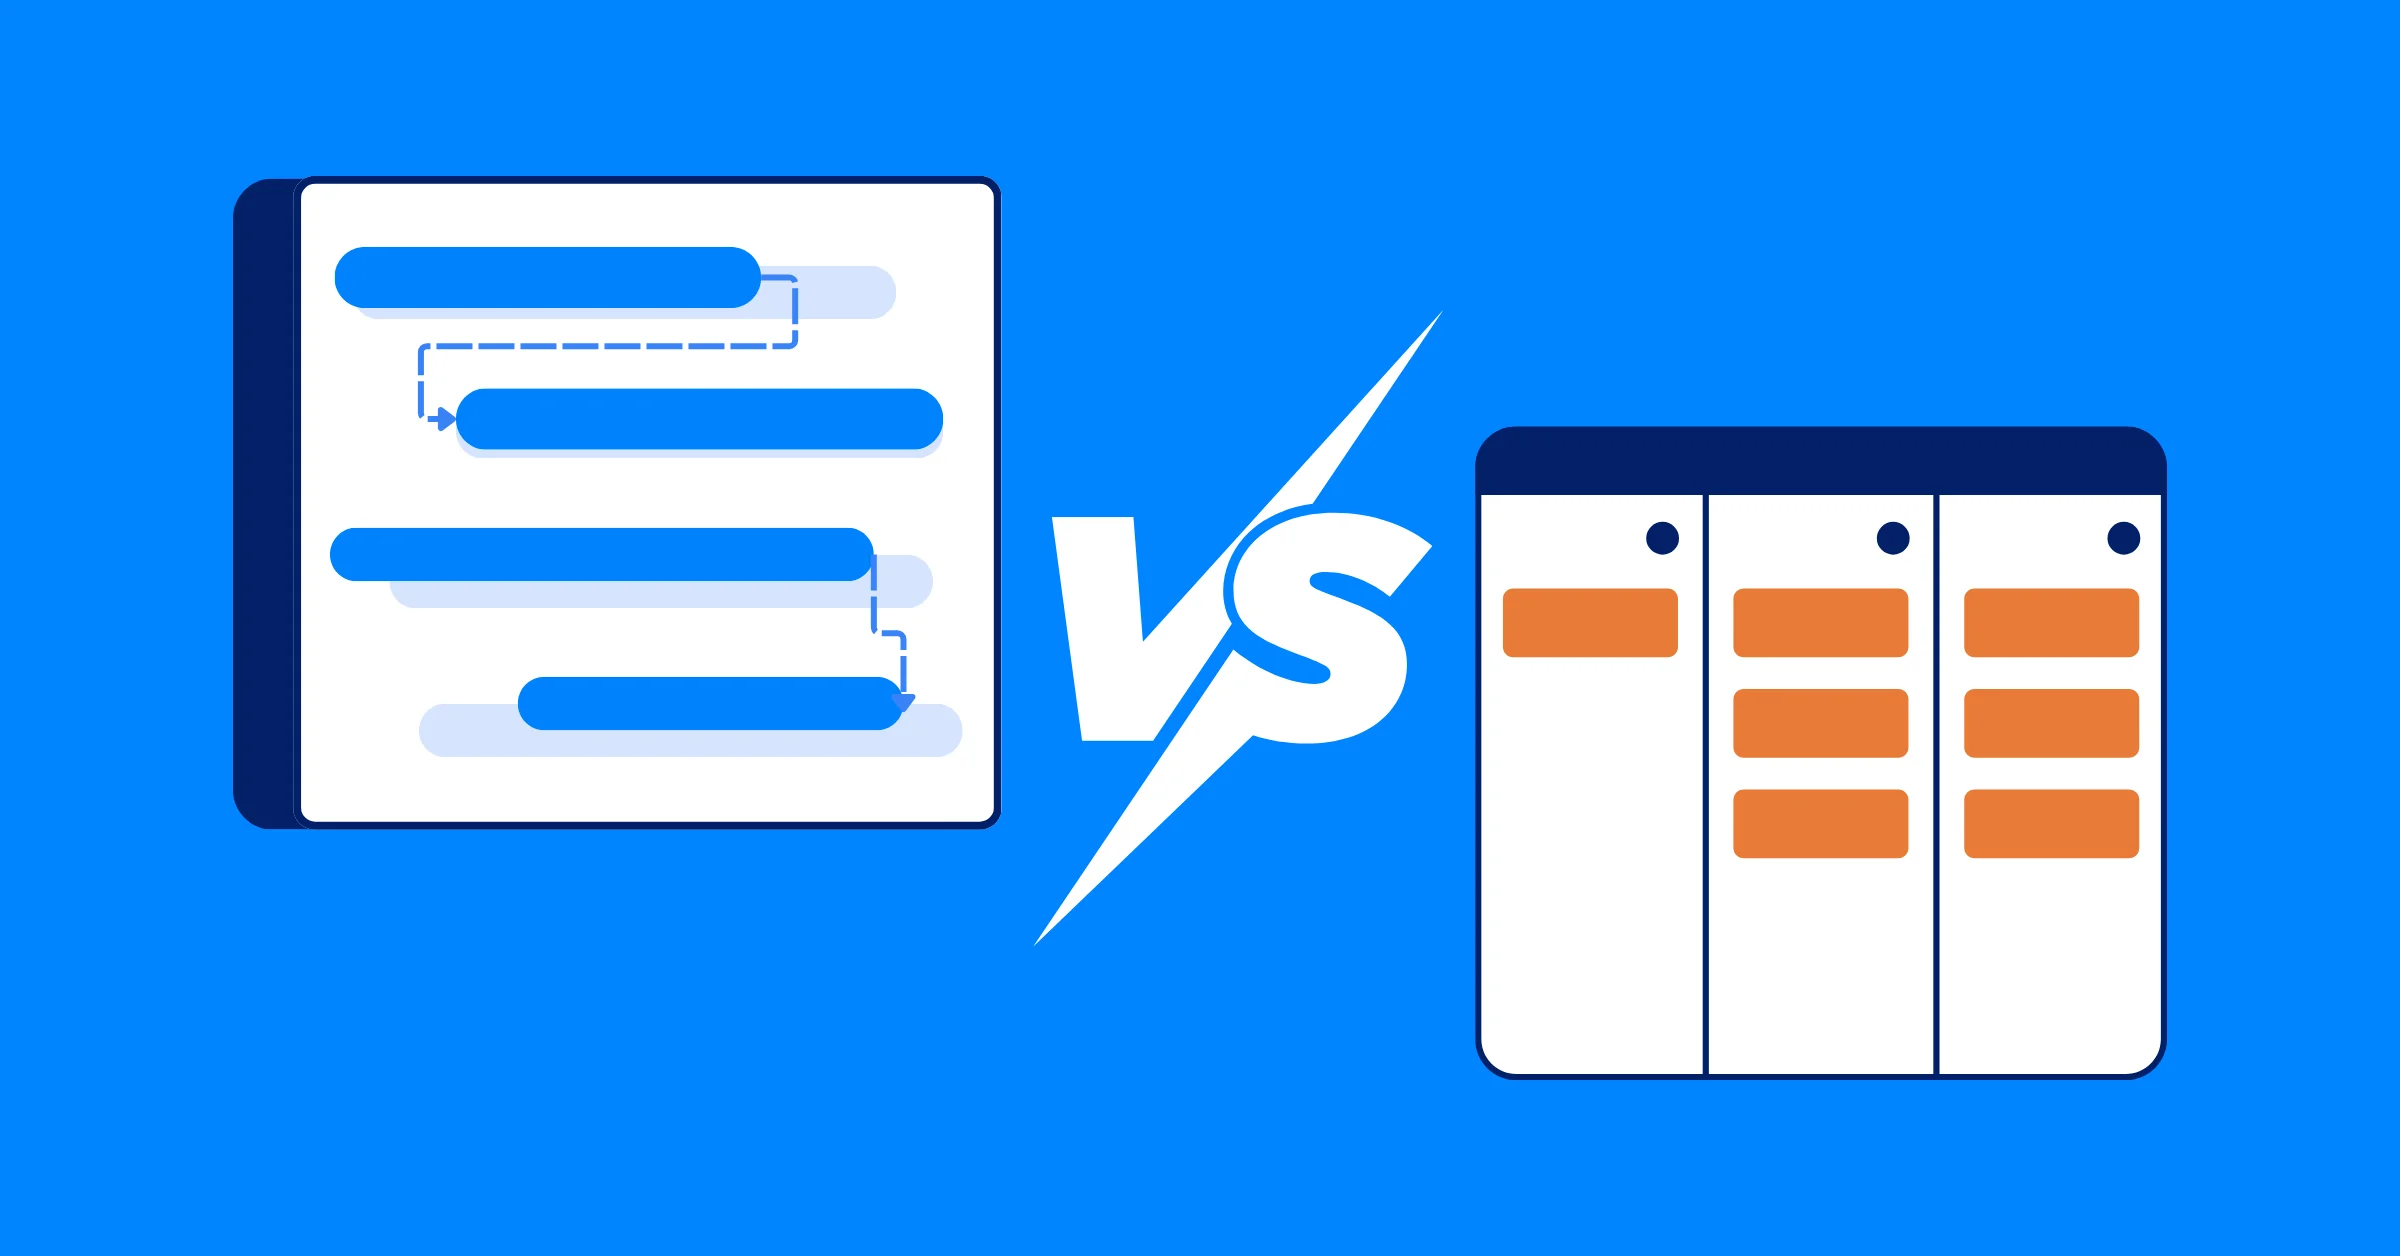
- Gantt Chart vs Kanban: Which one is better for your Team’s Workflow?
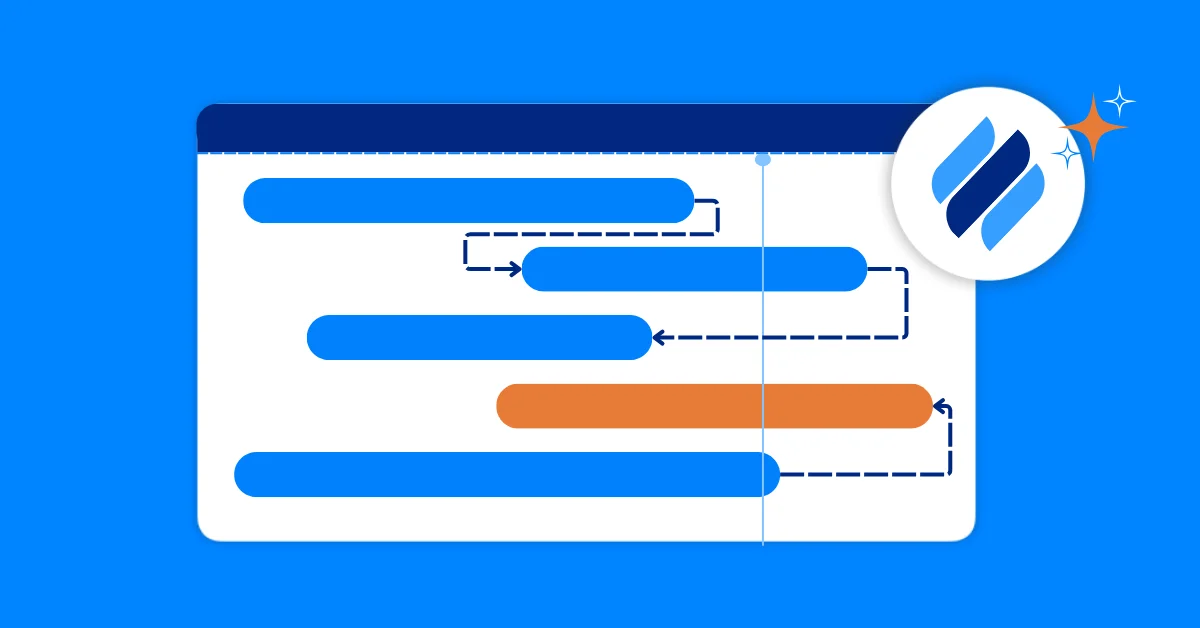
- Gantt Chart Dependencies: 4 Common Types of Dependencies & When to Use Them
- Resource Breakdown Structure (RBS): The Ultimate Guide for Project Managers
Related Articles















How to Build and Manage a Product Roadmap with TaskFord














How to Build a Connected Project Timeline in TaskFord













What Are the Best Jira Alternatives for Scrum Teams?






















How WBS Reveals Delivery Breakdown Before It’s Too Late










![How To Conduct a Profound Stakeholder Analysis [+ Free Template]](/marketing/blog/stakeholder-analysis.webp)


















What to Look for in Scrum Tools (Beyond Kanban Boards)

![Project Management Calendar for Teams and Managers [Free Templates]](/marketing/blog/project-management-calendar.webp)







How to Define Project Deliverables: A Step-by-Step Guide










![RACI Chart in Project Management: Rules & Examples [Free Download]](/marketing/blog/raci-chart.webp)


















![7 Must-Have Project Management Documents Every PO Should Know [Free Templates]](/marketing/blog/project-management-documents.webp)











![How to Create a Winning Project Plan for IT Projects [10 Steps Included]](/marketing/blog/how-to-create-a-project-plan.webp)


![Daily Standup Best Practices: Apply AI to Organize Meetings Successfully [2026 Trends]](/marketing/blog/daily-standup.webp)






![How to Create a Project Communication Plan: Step-by-Step Guide [+Free Template]](/marketing/blog/project-communication-plan.png)


![Master Project Procurement Management in 5 Steps [Download a free plan template]](/marketing/blog/project-procurement-management.webp)






























Subscribe for Expert Tips
Unlock expert insights and stay ahead with TaskFord. Sign up now to receive valuable tips, strategies, and updates directly in your inbox.