Key Work Delivery Statistics for 2026: Trends, Productivity & Project Management
Key work delivery statistics for 2026, featuring the latest research on project management, productivity, employee engagement, collaboration, and work trends.
Have you ever wondered how much work actually gets delivered on time, and what separates high-performing teams from those constantly missing deadlines?
Or, you might be interested in how AI, automation, and resource management are changing the way teams get things done in 2026.
There’s a lot of work delivery statistics out there, from employee engagement and project success rates to AI adoption and last-mile delivery costs.
So, we’ve combed through the latest reports and selected the most important information for you.
Read on!
Key work delivery statistics
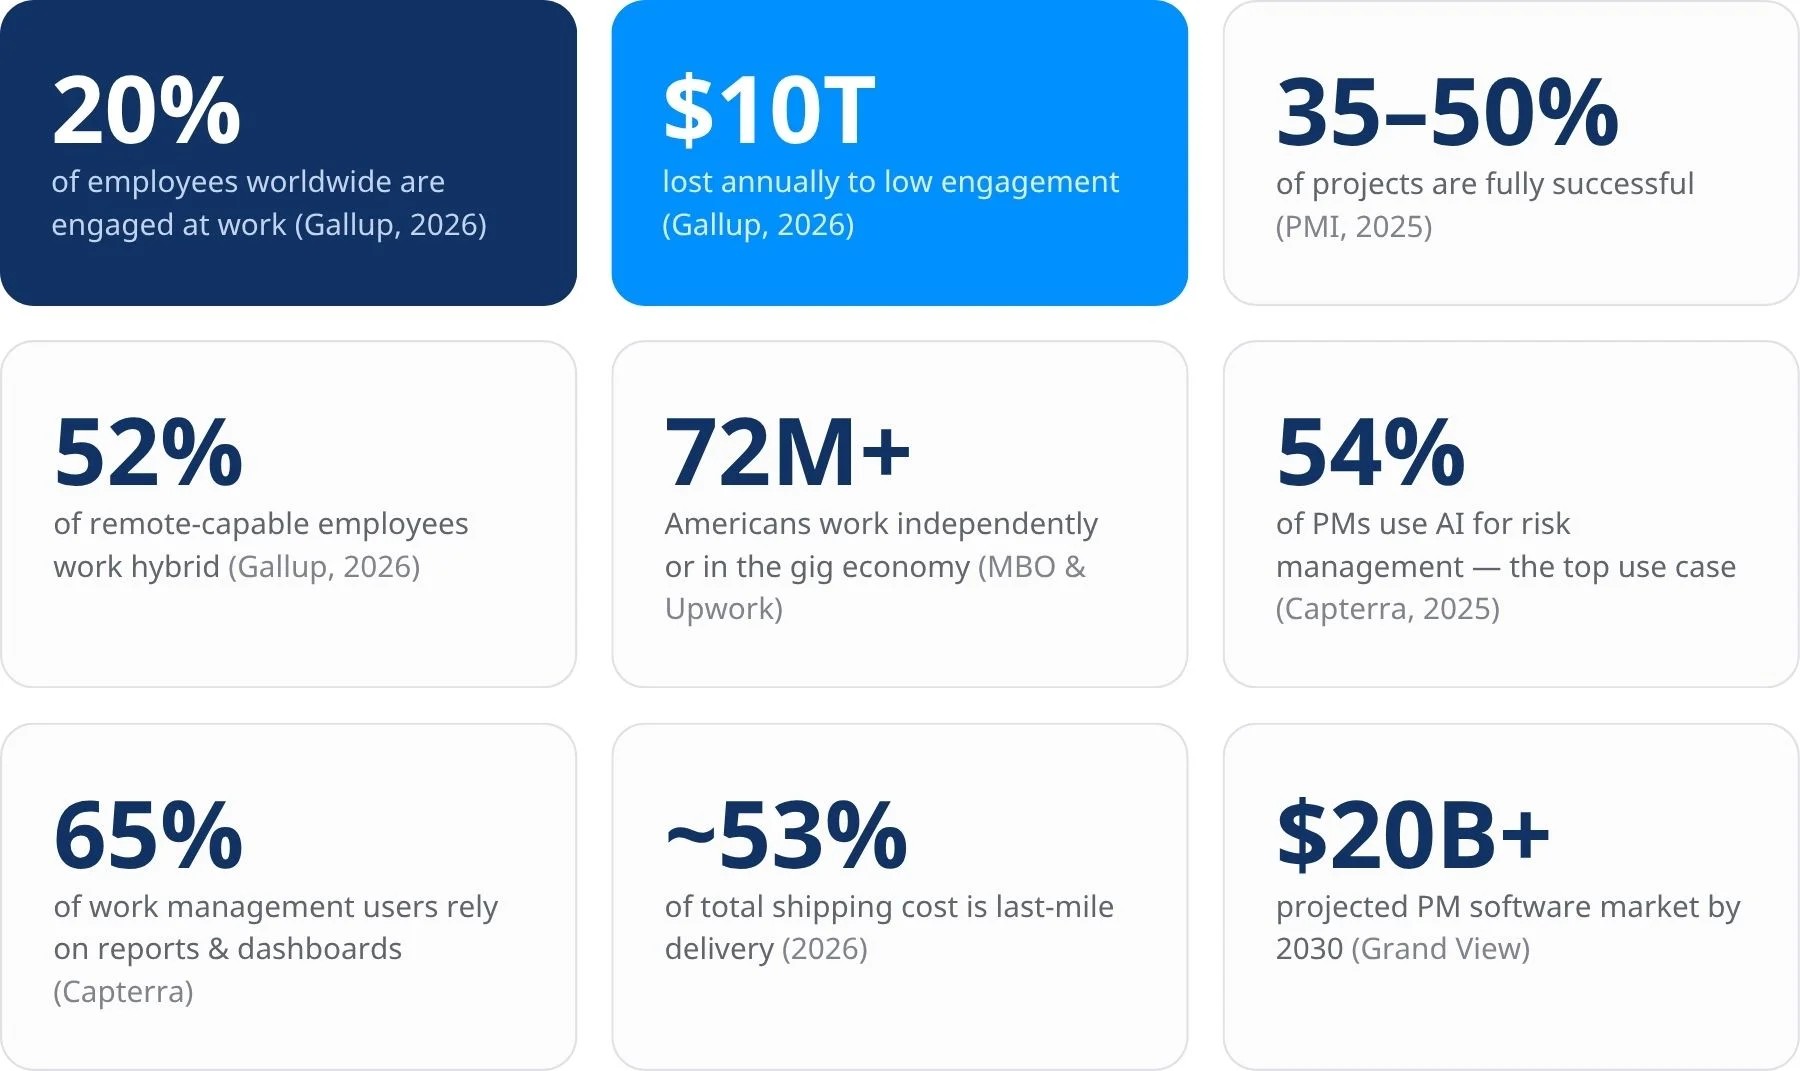
To give you a taste of what’s to come, here are some of the most important work delivery statistics in 2026:
- Only 20% of employees worldwide are engaged at work.
- Low employee engagement costs the global economy approximately $10 trillion in lost productivity each year.
- Only 35–50% of projects achieve full success.
- 52% of remote-capable employees now work in a hybrid model.
- More than 72 million Americans participate in independent or gig work.
- 54% of project managers use AI for risk management.
- 65% of project management software users regularly rely on reports and dashboards.
- Last-mile delivery represents approximately 53% of total shipping costs.
- The global project management software market is expected to exceed $20 billion by 2030.
Read also: What Is Integrated Work Delivery? How It Goes Beyond the Traditional Model
General work delivery statistics for 2026
These statistics highlight the biggest challenges organizations face when trying to deliver work efficiently.
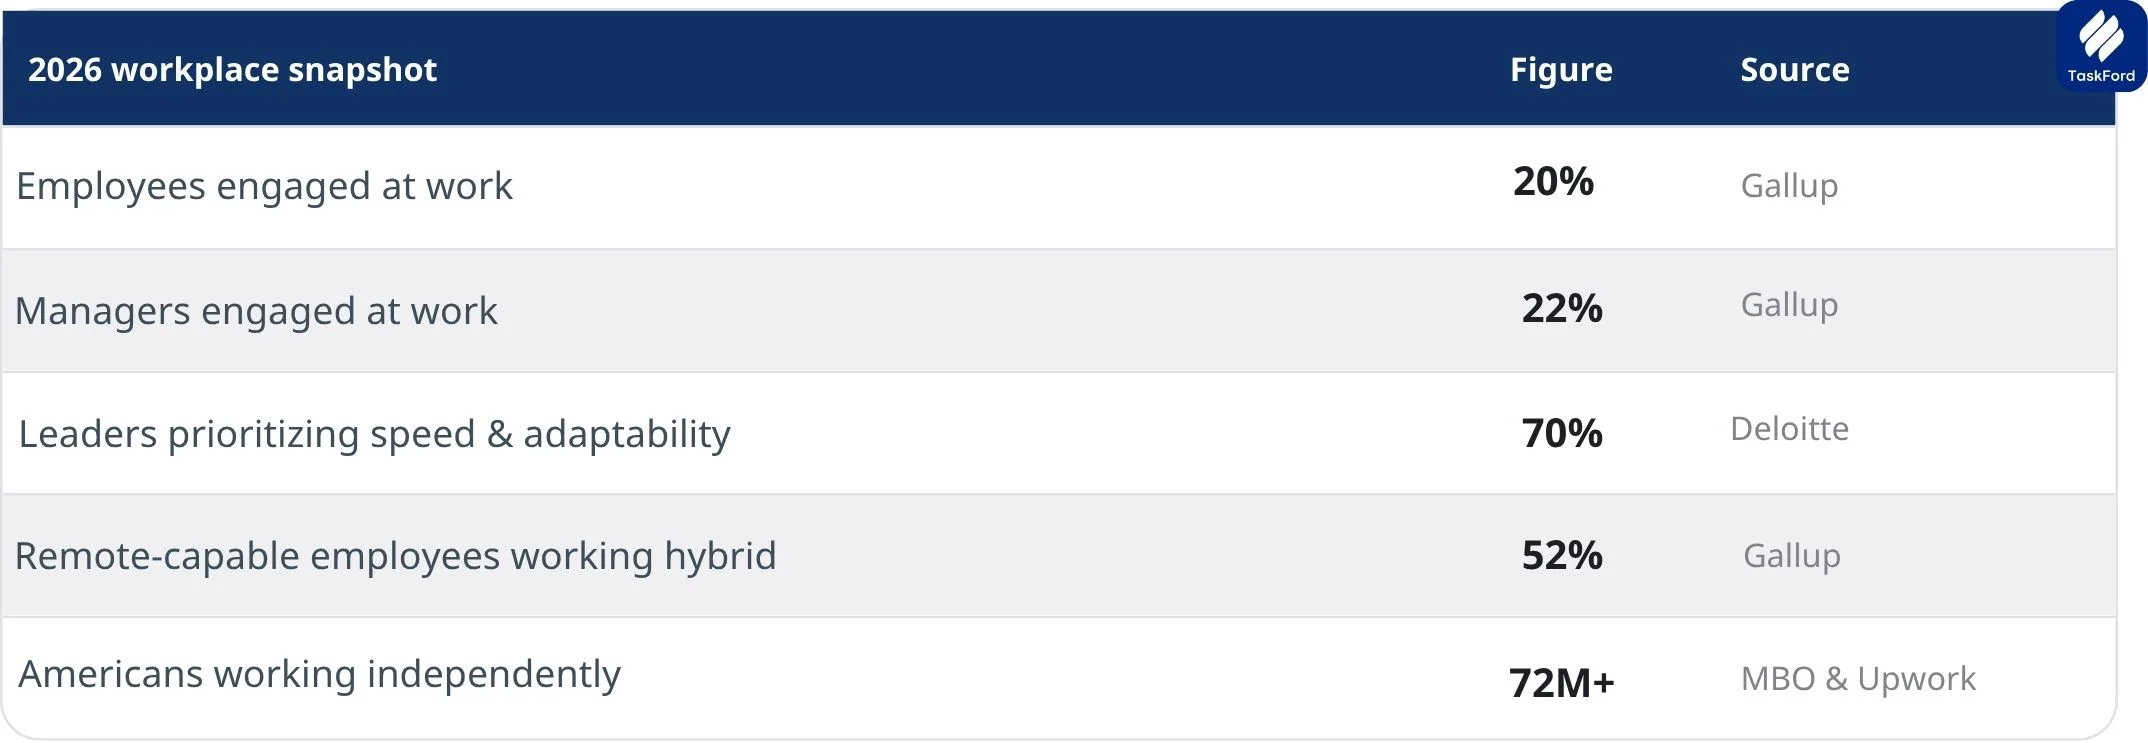
Only 20% of employees worldwide are engaged at work
According to Gallup’s State of the Global Workplace 2026 report, only 1 in 5 employees is actively engaged at work. Gallup also estimates that low engagement costs the global economy around $10 trillion in lost productivity every year.
Employee engagement directly influences work delivery. Engaged employees are more likely to take ownership, solve problems proactively, collaborate with teammates, and keep projects moving forward. When engagement is low, productivity suffers and delivery becomes less predictable.
Manager engagement dropped to 22%
Gallup also reports that manager engagement has fallen to 22%.
Managers play a critical role in coordinating work, setting priorities, removing blockers, and keeping teams aligned. When managers become disengaged, organizations often experience slower decision-making, weaker communication, and increased project delays.
Improving manager effectiveness remains one of the most impactful ways to improve work delivery across an organization.
7 in 10 business leaders say speed and adaptability are their main strategy
According to Deloitte’s 2026 Global Human Capital Trends report, 7 in 10 business leaders say their main strategy for the next 3 years is to be fast and adaptable.
This shows how important work delivery has become. Teams need to move quickly, adjust plans when priorities change, and use their resources wisely.
In other words, successful work delivery is not just about finishing tasks. It is also about helping the business respond faster to change.
Human capacity is becoming harder to manage
Deloitte highlights that human capacity is becoming one of the most valuable business resources.
Wellingtone also identifies resource management as one of the most common obstacles to successful project delivery.
Instead of simply assigning more work, organizations must balance workloads, understand team availability, and ensure the right people are working on the highest-priority initiatives. Companies with better resource visibility are better equipped to prevent burnout while maintaining delivery performance.
Key takeaway: Modern work delivery is no longer limited by project plans—it is limited by how effectively organizations manage people and capacity.
Only 34% of organizations mostly or always complete projects on time
According to Wellingtone’s State of Project Management report, only 34% of organizations report that they mostly or always complete projects on schedule.
The report also shows that many organizations struggle to deliver projects on budget and achieve the expected benefits.
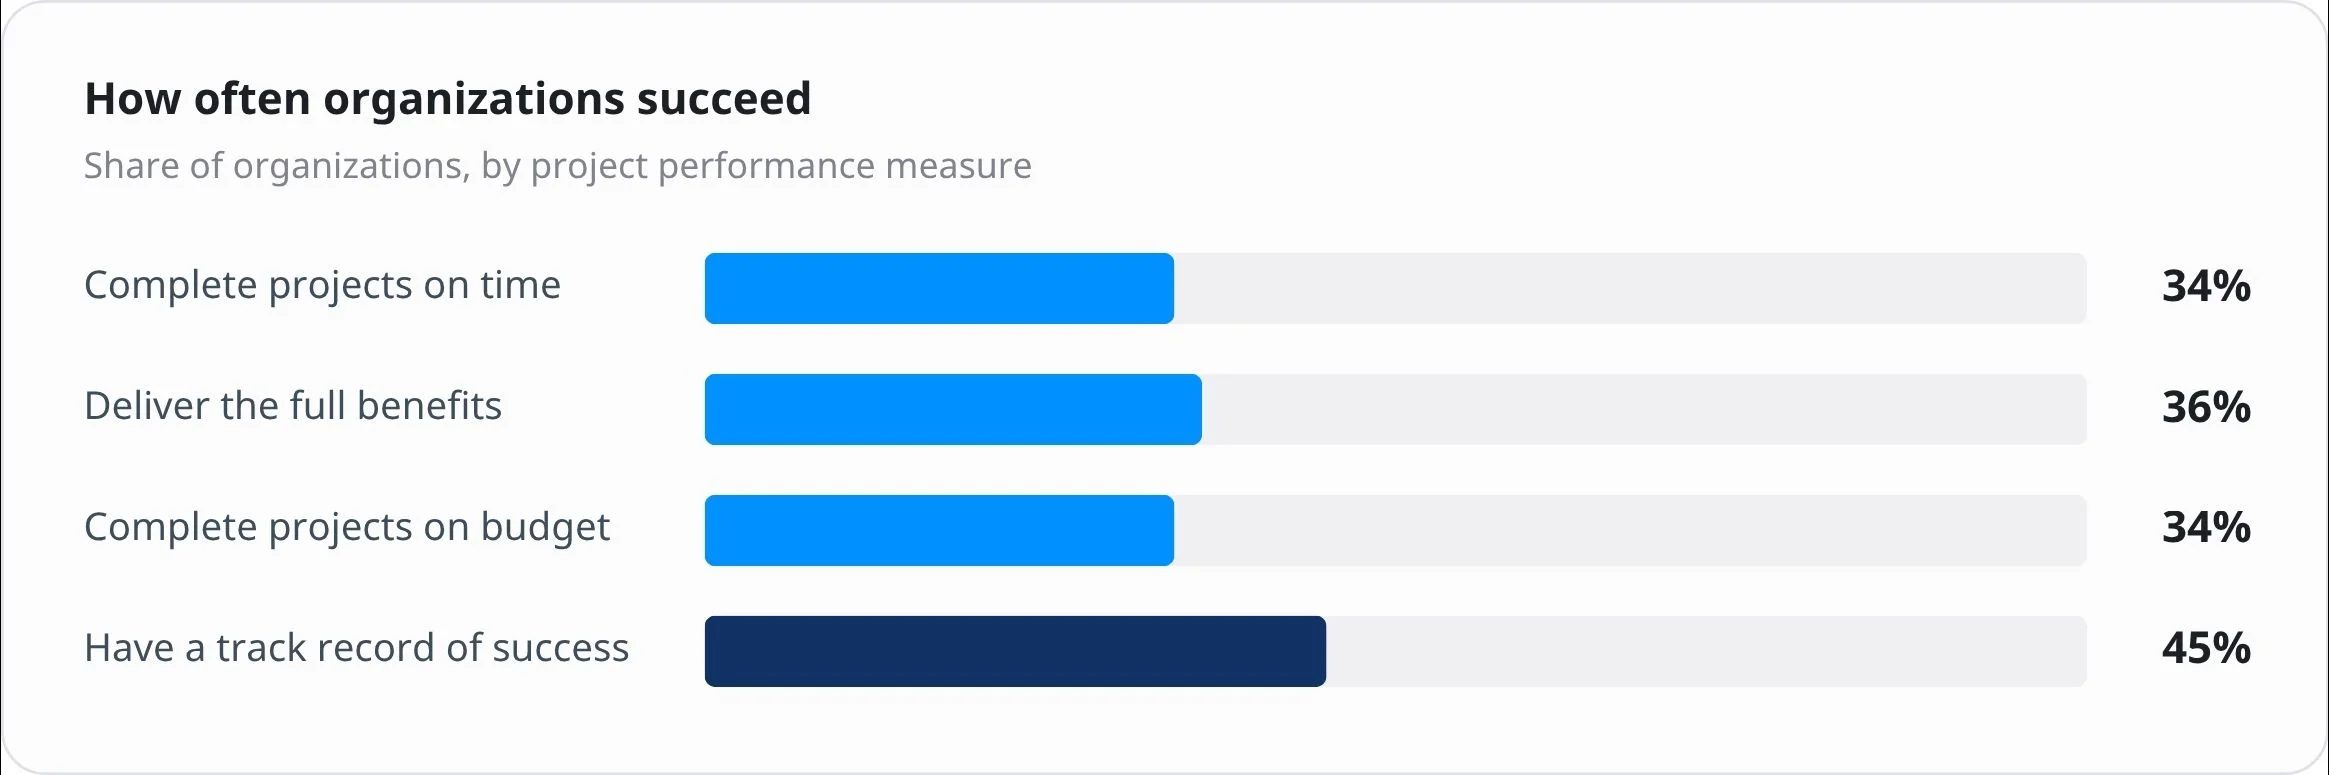
These numbers show that many teams still find it hard to deliver work predictably.
A project may have a plan, deadline, and budget. But that does not always mean the work will be delivered successfully. Teams also need clear ownership, realistic timelines, good communication, and enough resources.
Clear goals and progress tracking help teams deliver better results
PMI also found that successful projects are significantly more likely to have a clearly defined vision, measurable success criteria, consistent progress tracking, ongoing alignment with business objectives.
Teams that regularly measure progress and adjust plans throughout execution are better positioned to respond to changing priorities and deliver successful outcomes.
Work delivery software statistics for 2026
Check out the current work delivery trends when it comes to project management software, work management tools, dashboards, automation, and resource planning.
65% of project management software users rely on reports and dashboards
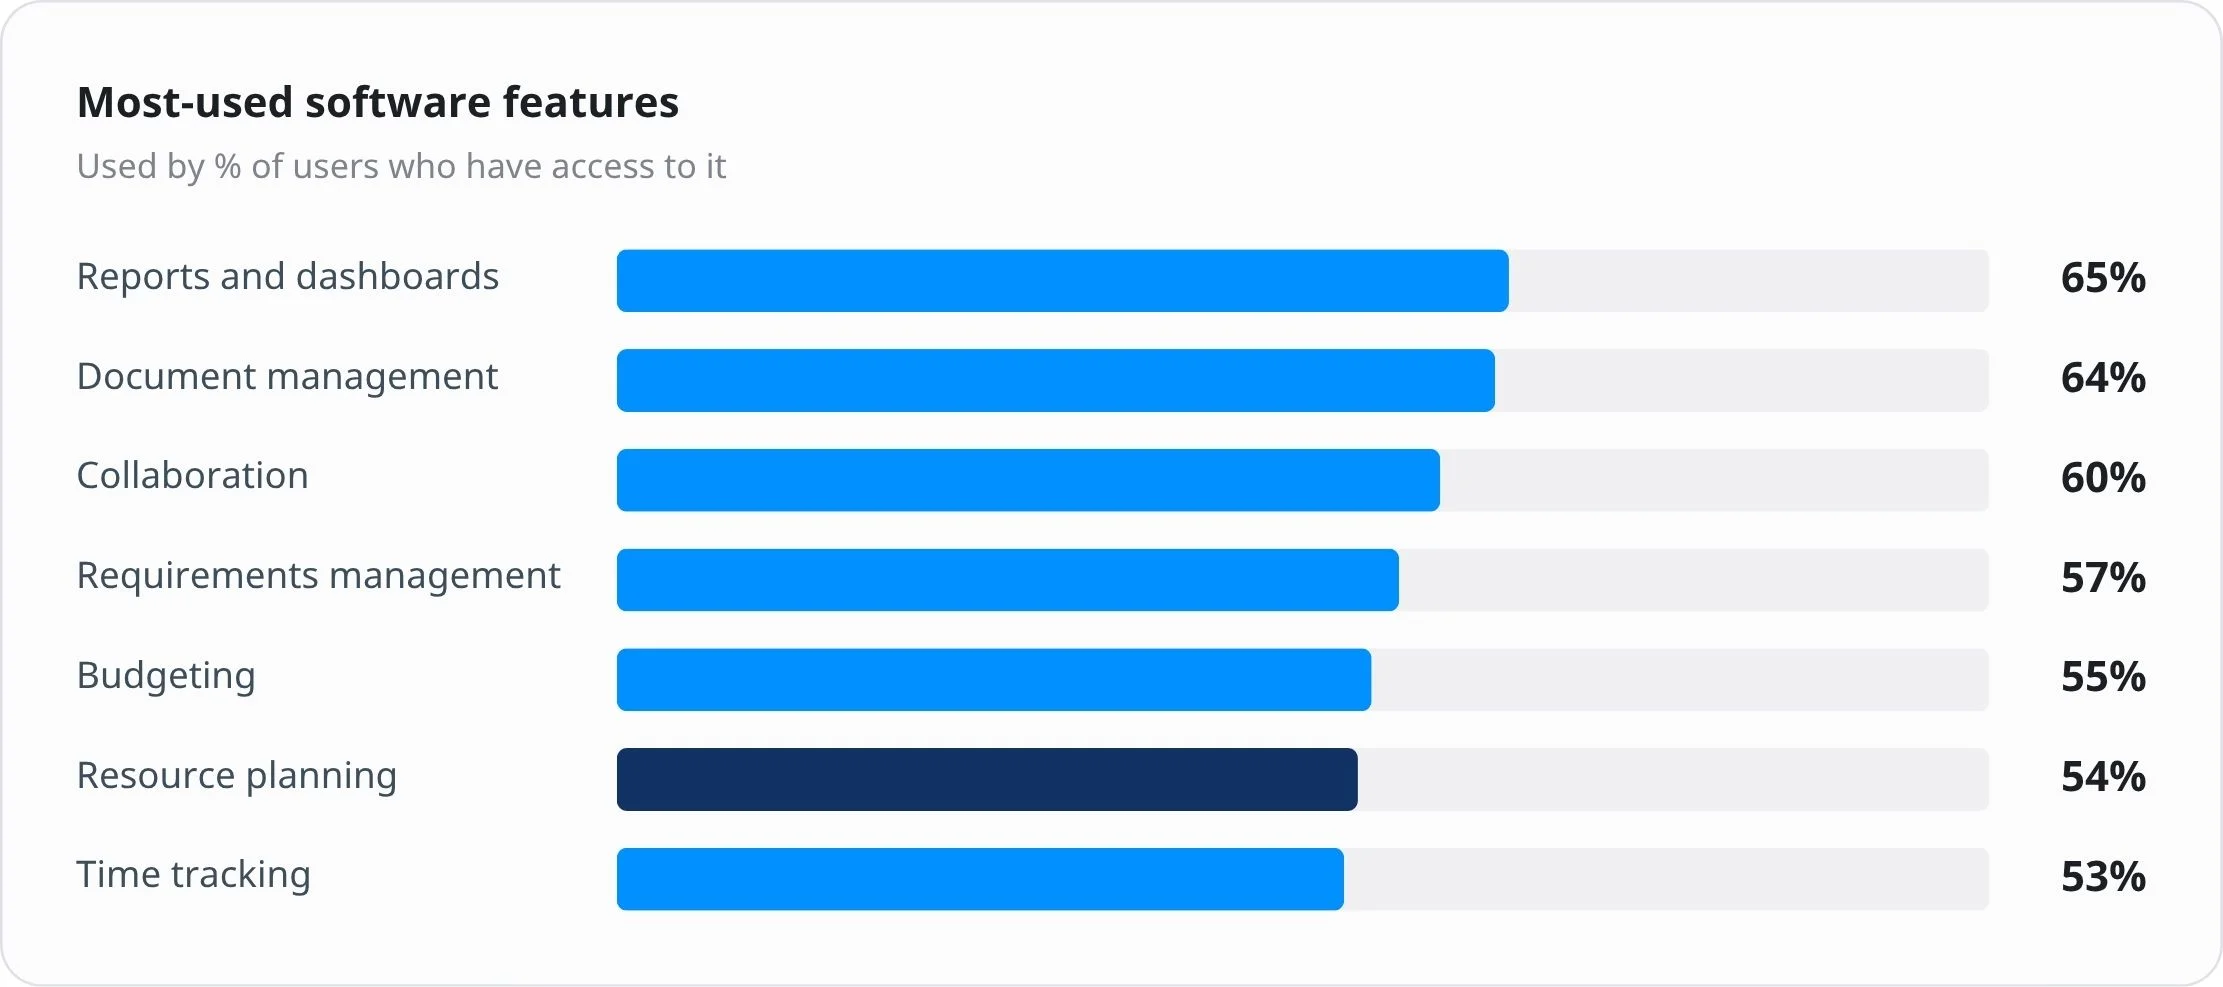
According to Capterra’s Project Management Software Market Research Report, reports and dashboards are the most frequently used project management software feature, with 65% of users relying on them.
As organizations manage multiple projects simultaneously, visibility becomes essential. Dashboards provide a centralized view of project status, deadlines, workloads, and potential bottlenecks, allowing managers to make faster, more informed decisions.
Document management and collaboration are also among the most-used software features
Capterra also found that document management and collaboration tools are among the most widely used project management capabilities.
Here’s the breakdown of the most-used project management software features:
Modern work delivery extends beyond task management. Teams need a single workspace where they can store documents, communicate, review work, share feedback, and collaborate throughout the project lifecycle.
For example, a marketing team might use one platform to:
- Manage campaign briefs and creative assets
- Review and approve content
- Track project progress
- Coordinate feedback across stakeholders
- Monitor team workloads
When collaboration, documentation, and project tracking are integrated, teams spend less time switching between tools and more time delivering work.
Resource planning is used by 54% of project management software users
Among users who have access to resource planning features, 54% actively use them. (Source: Capterra, Project Management Software Market Research Report.)
A well-designed project plan is only effective if the right people are available to execute it. As projects become increasingly complex, resource planning has become a core capability rather than an optional feature. This is why resource management is closely connected to the work delivery gap.
Grand View Research also forecasts the resource management software segment to grow at a 16.5% CAGR through 2030.
This trend reflects a broader shift in how organizations approach work delivery.
Organizations with strong resource visibility can make more informed staffing decisions, reduce delivery risks, and respond more effectively to changing priorities.
Many organizations still underuse advanced project management features
Despite investing in project management software, many teams rarely use advanced capabilities such as Gantt charts, burndown charts, and velocity charts.
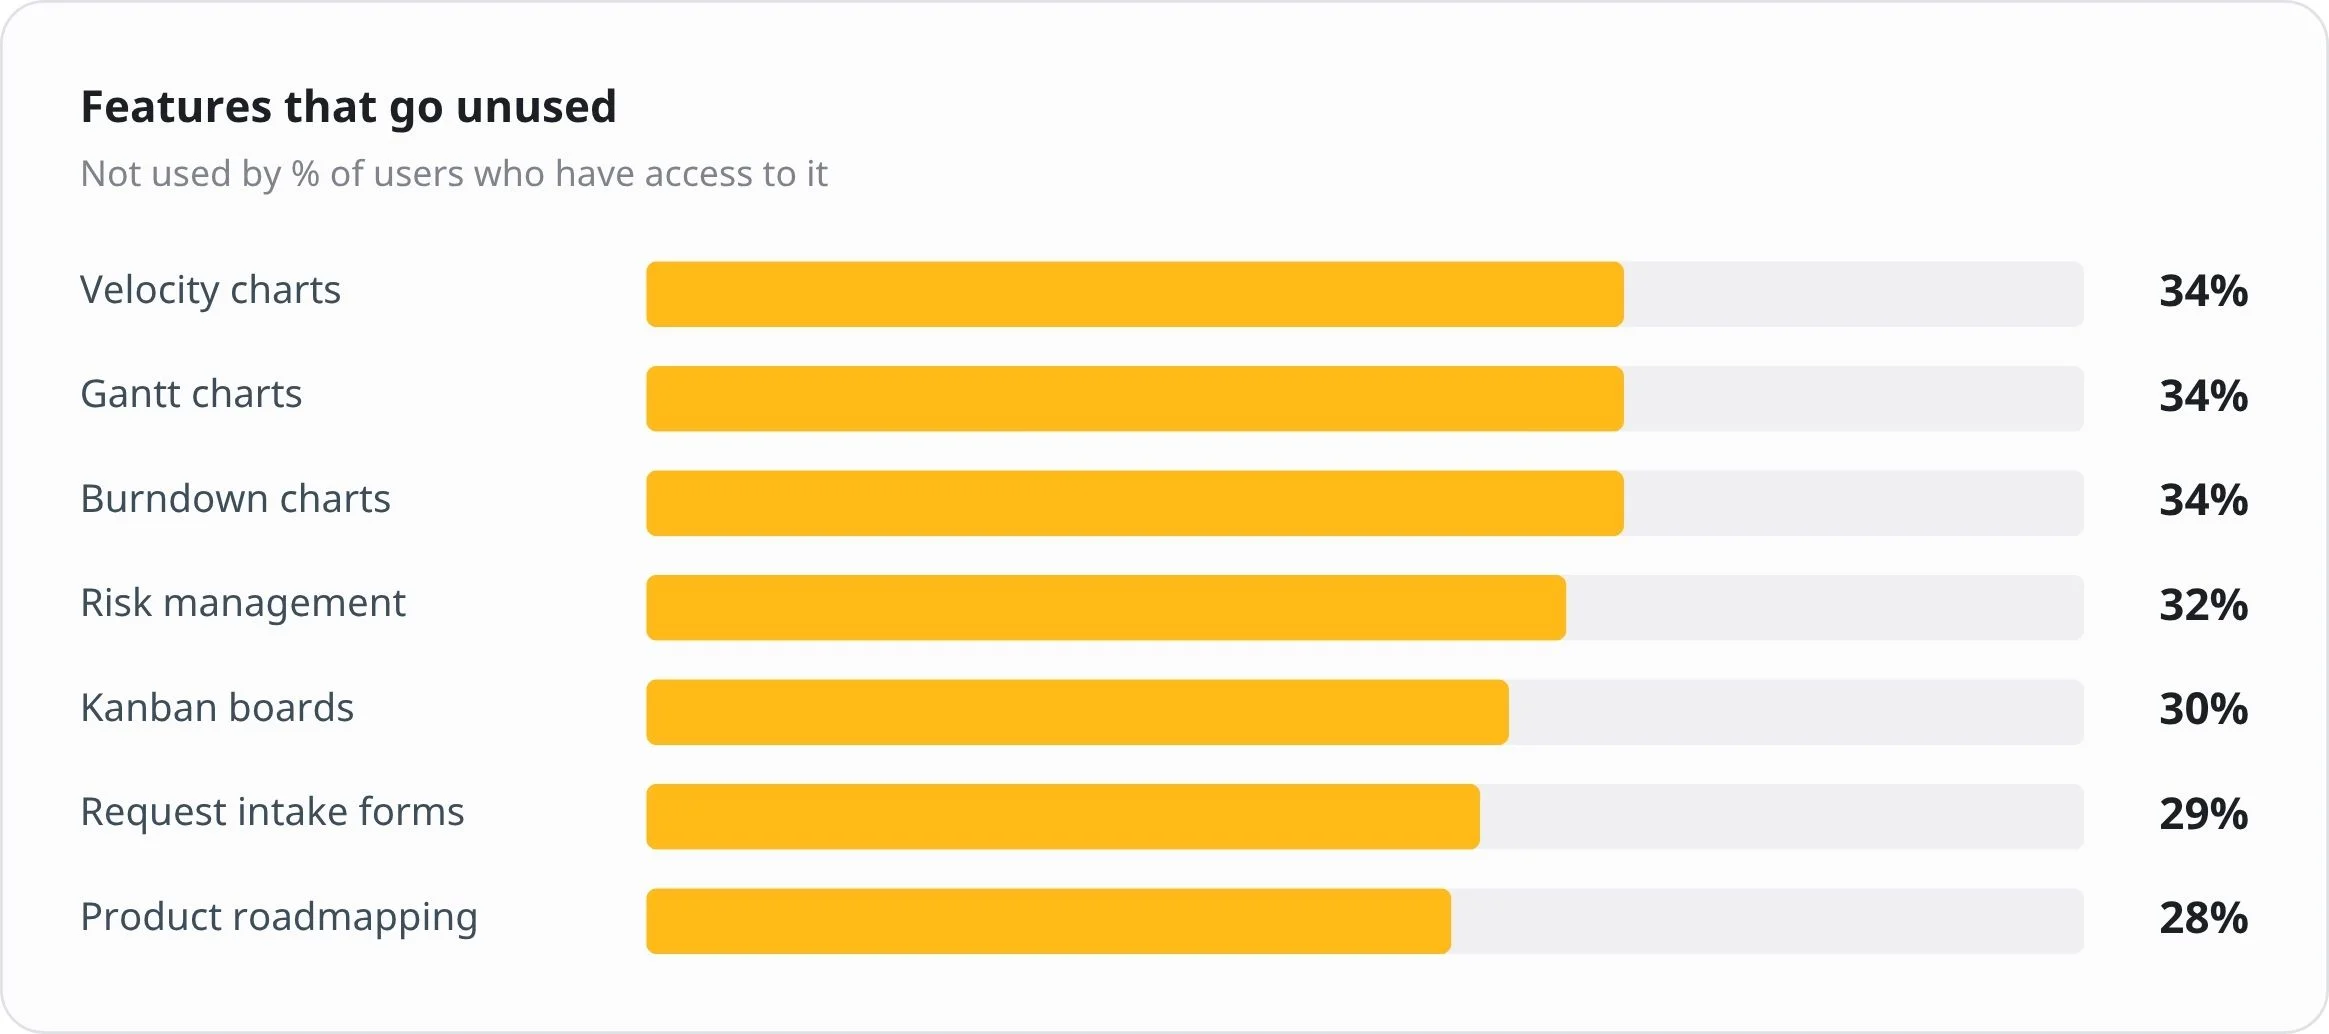
This suggests that successful work delivery depends on more than software adoption alone. Features must be easy to understand, fit naturally into existing workflows, and solve real operational challenges before teams will use them consistently.
For software vendors, usability and adoption are becoming just as important as feature availability.
1 in 5 project management software users wants Gantt charts, burndown charts, and automated workflows
Capterra also found that many users want features they do not currently have.
The most wanted features include Gantt charts, burndown charts, automated workflows, and velocity charts.
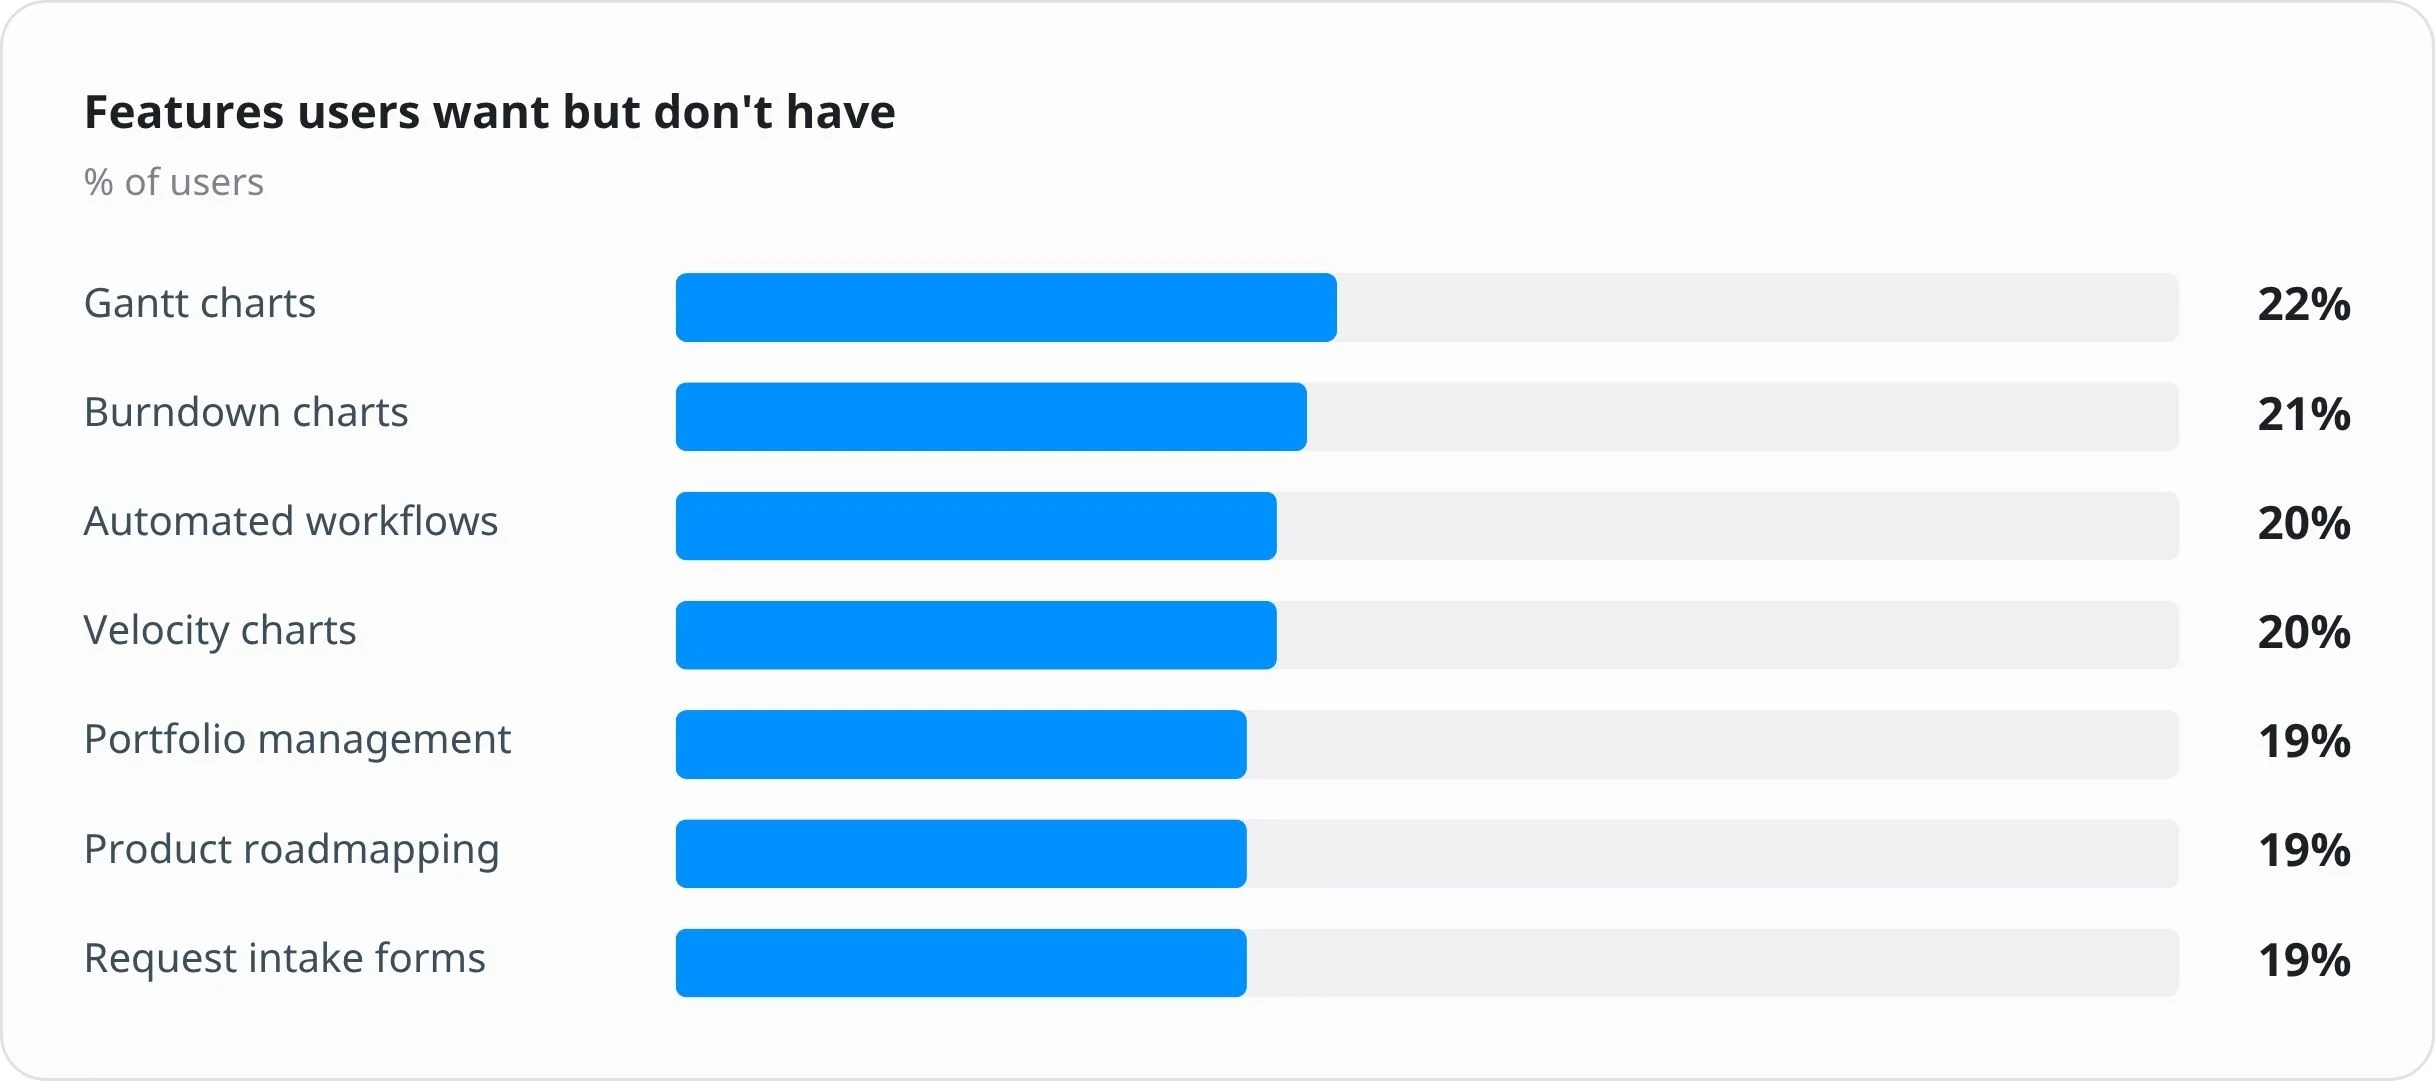
Interestingly, organizations that already have these features often don’t use them regularly, while teams without them frequently identify them as highly desirable.
This highlights an important lesson: adding features alone does not improve work delivery. Organizations see greater value when software is intuitive, easy to adopt, and supports the way teams actually work.
The project management software market will exceed $20 billion by 2030
According to Grand View Research, the global project management software market is projected to grow from $6.59 billion in 2022 to $20.47 billion by 2030, representing a CAGR of 15.7%.
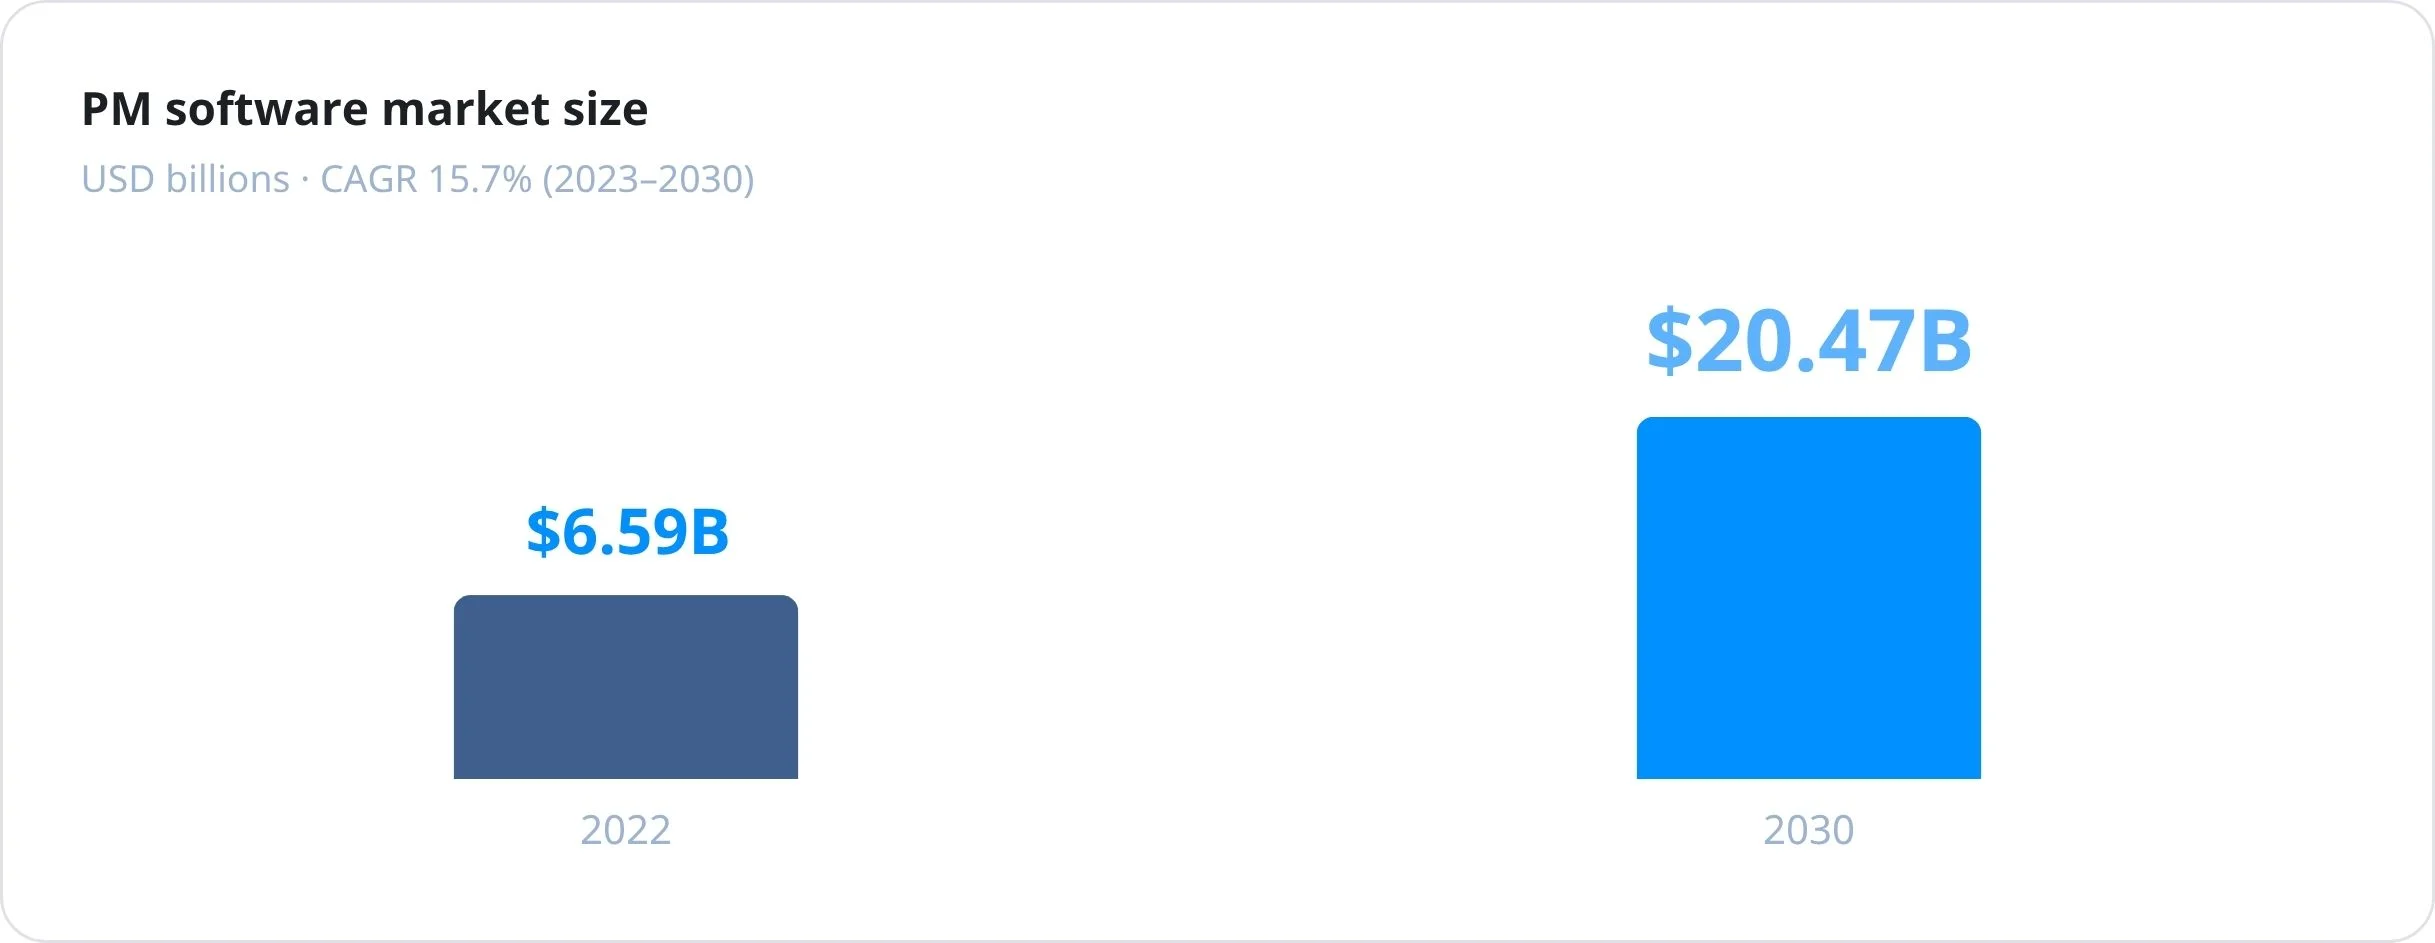
This growth shows how important work management software has become.
Modern project management platforms now support much more than task tracking. They help organizations plan and prioritize projects, coordinate cross-functional teams, track progress in real time, improve collaboration, manage resources and Automate repetitive processes.
As work becomes more dynamic, integrated work management platforms are becoming a strategic investment rather than simply a productivity tool.
Key takeaway
Project management software is no longer just about organizing tasks. The most successful organizations use these platforms to improve visibility, balance workloads, strengthen collaboration, and make better delivery decisions.
However, software alone does not guarantee better outcomes. The greatest improvements come when teams consistently adopt the right features and integrate them into their daily workflows.
AI work delivery statistics for 2026
AI is rapidly changing how organizations plan, execute, and deliver work. Rather than replacing project managers, AI is helping teams automate repetitive tasks, identify risks earlier, improve planning accuracy, and make faster decisions.
The following statistics highlight how AI is influencing work delivery in 2026.
55% of project management software buyers say AI was the top reason for their purchase
According to Capterra’s 2025 Project Management Software Trends Survey, 55% of buyers said AI capabilities were the primary reason they selected their most recent project management platform.
This marks a significant shift in buyer priorities. Organizations are no longer looking only for software to organize tasks—they expect intelligent tools that can help teams work more efficiently and make better decisions.
Today, AI is increasingly used to:
- Generate project summaries
- Automate routine workflows
- Analyze project risks
- Assist with planning and scheduling
- Support resource allocation
As AI capabilities mature, they are becoming a key differentiator in the project management software market.
54% of project managers use AI for risk management
Capterra’s 2024 Most Impactful Project Management Tools Survey found that 54% of project managers using AI apply it to risk management, making it the most common AI use case.
Projects rarely fail because of a single event. More often, delays result from risks that go unnoticed until they become difficult to resolve.
By analyzing historical data, project schedules, workloads, and dependencies, AI can help teams identify potential issues earlier, allowing managers to take action before delivery is affected.
Task automation is one of the most common AI use cases in project management
Another major AI application is task automation. According to Capterra, 53% of organizations using AI in project management apply it to automate repetitive administrative work.
Common examples include:
- Sending reminders
- Updating task status
- Assigning work automatically
- Creating recurring reports
- Routing requests
- Triggering approval workflows
Automating routine processes reduces manual effort, minimizes human error, and allows project teams to spend more time on planning, collaboration, and problem-solving.
AI is expanding into planning, scheduling, and resource management
Capterra’s AI project management data shows that teams use AI for several work delivery activities, not just automation.
Here’s the breakdown of common AI use cases in project management:
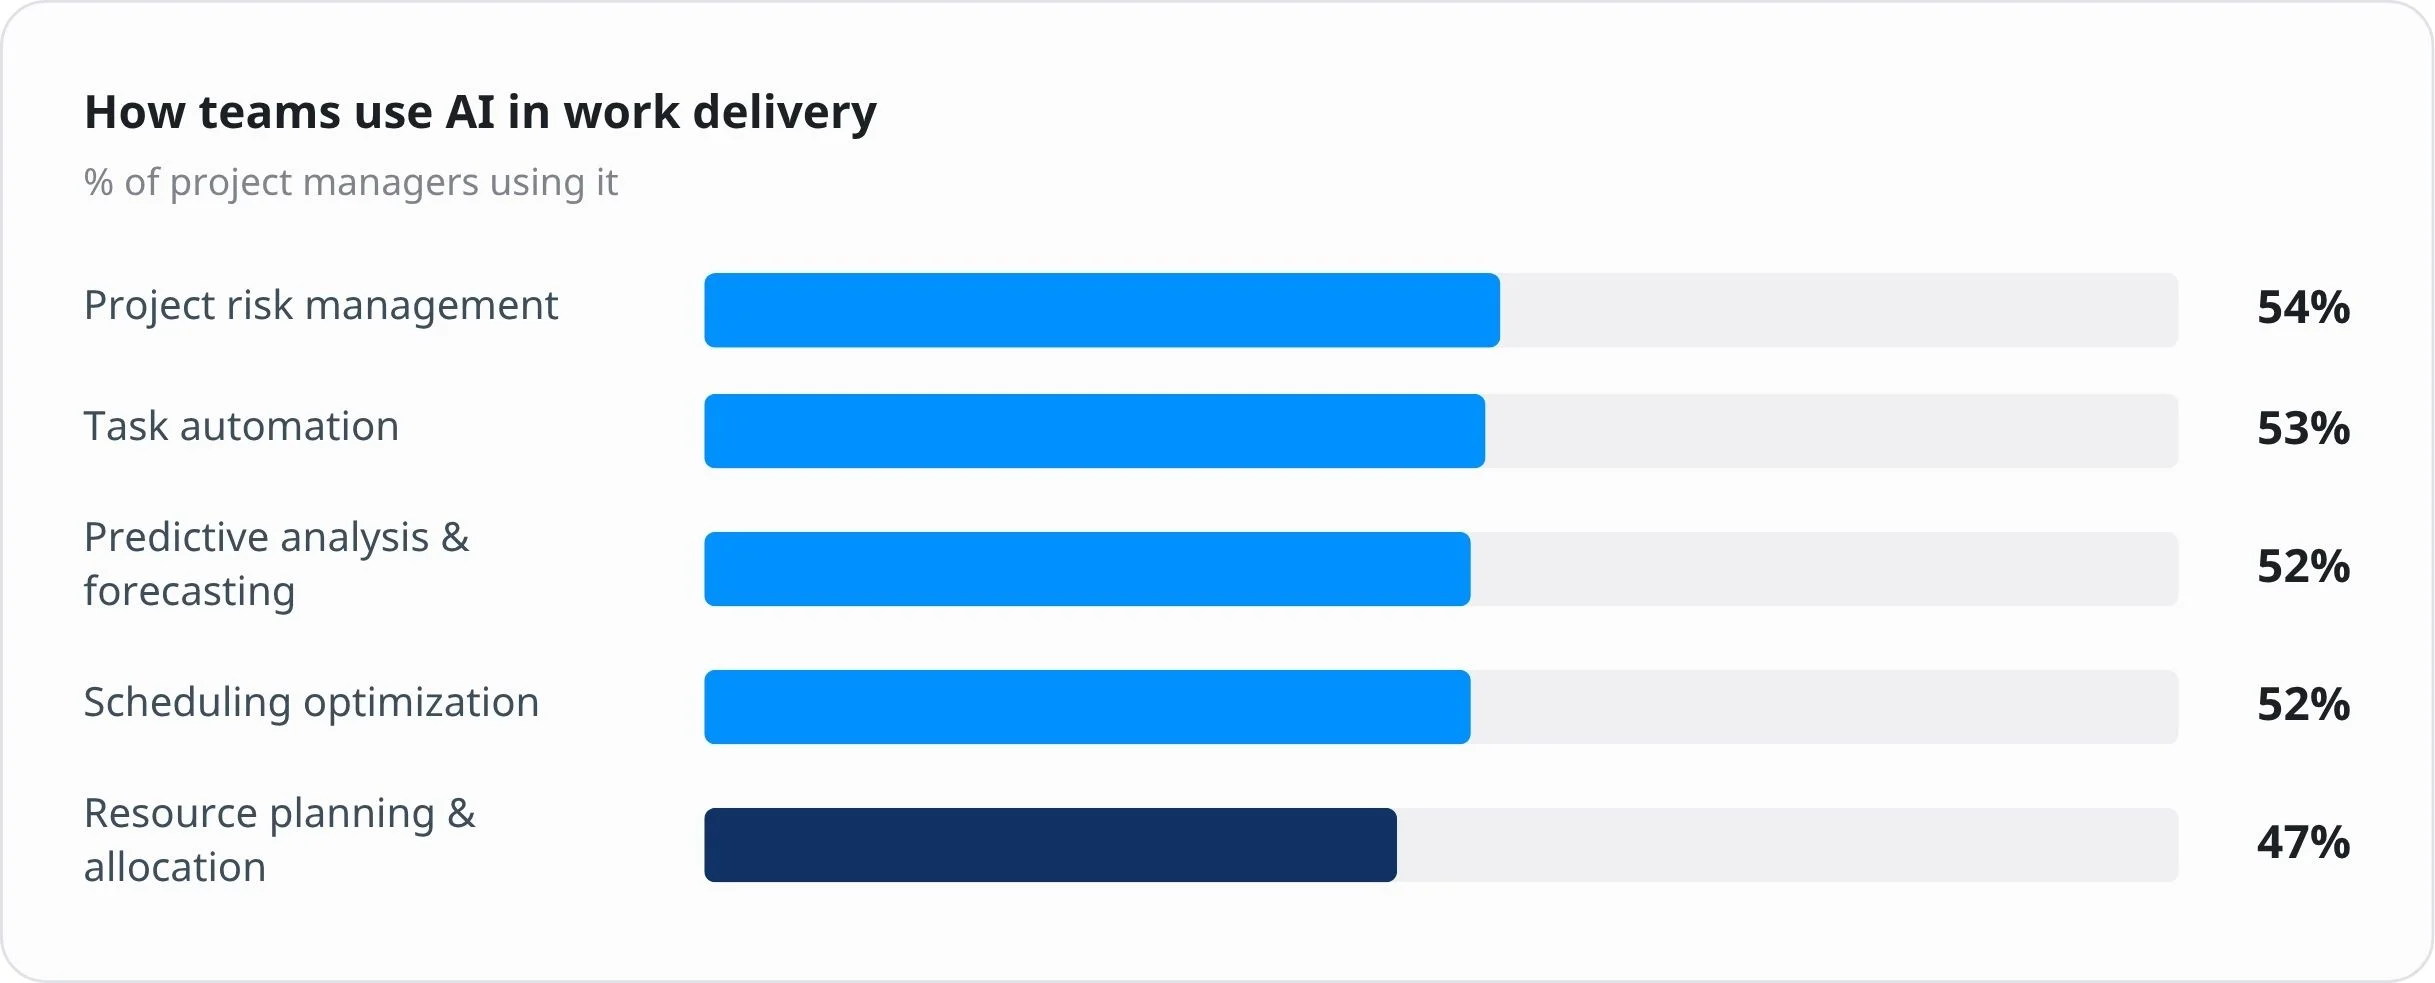
Beyond automation, organizations are increasingly using AI to support: Predictive analytics, schedule optimization, resource planning, capacity forecasting, delivery forecasting.
These capabilities help managers understand how changes in priorities, workloads, or staffing may affect project timelines before problems arise.
Instead of simply reporting project status, AI is becoming a decision-support tool that helps organizations plan more effectively.
90% of project managers report positive ROI from AI investment
Capterra reports that 90% of project managers experienced a positive return on investment from AI during the past 12 months.
However, organizations achieve the greatest value when AI is built on accurate project data and well-defined processes. AI performs best when tasks, timelines, ownership, and priorities are already clearly managed.
63% of project managers say AI improves productivity and efficiency
According to Capterra, 63% of project managers identify increased productivity and efficiency as one of AI’s biggest advantages.
AI helps eliminate repetitive work while accelerating activities that traditionally require significant manual effort.
These capabilities allow project managers to spend less time on administrative work and more time leading projects and supporting their teams.
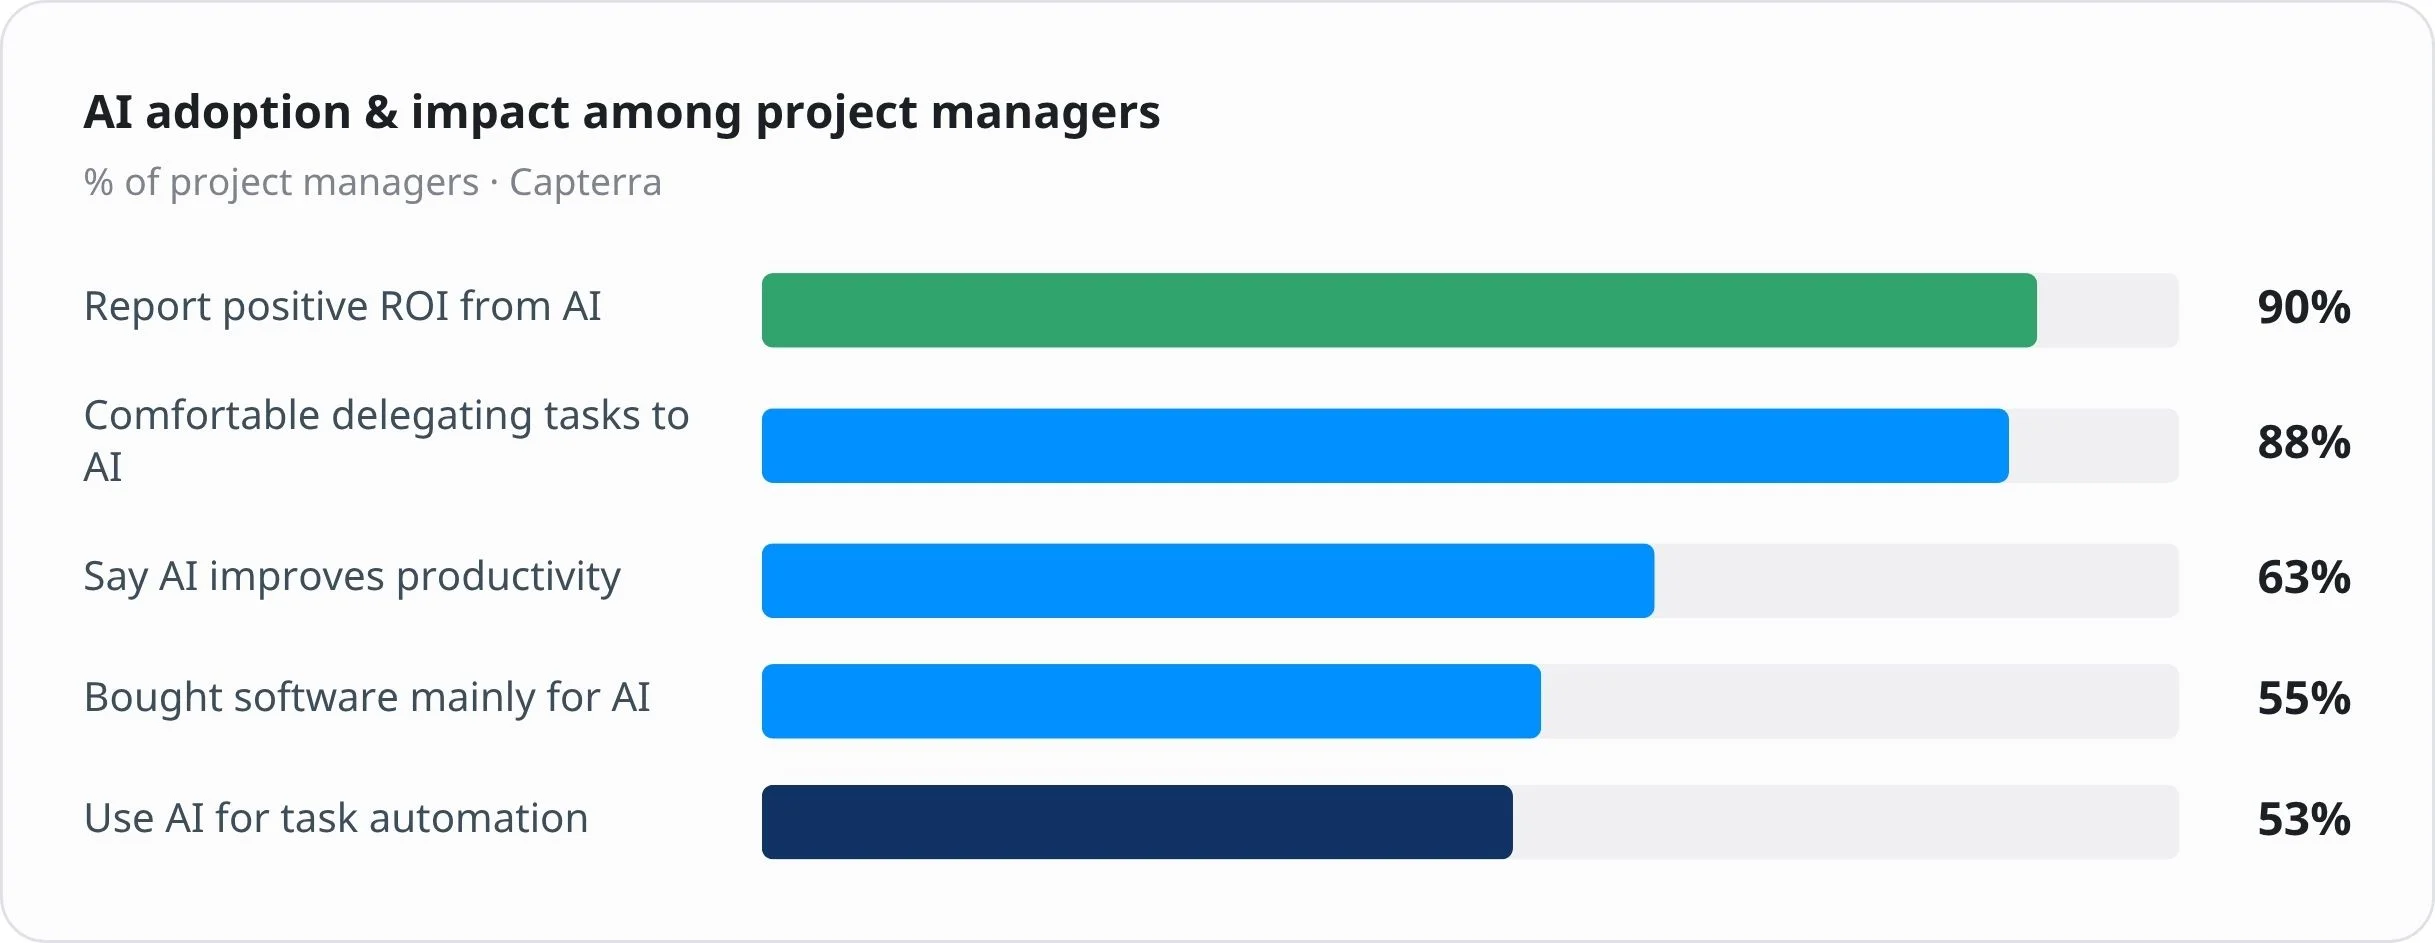
88% of project managers feel comfortable delegating important tasks to AI
Capterra also found that 88% of project managers feel comfortable allowing AI to handle important project activities.
This growing confidence reflects the increasing maturity of AI-powered work management tools. Many organizations now trust AI to support planning, reporting, scheduling, documentation, and workload analysis.
Even so, successful work delivery still depends on human leadership. Strategic priorities, stakeholder management, team dynamics, and business decisions continue to require human judgment.
Key takeaway
AI is transforming work delivery from reactive project management to proactive decision-making.
The most successful organizations are not replacing project managers with AI. They are equipping project managers with AI to make better decisions, respond more quickly to change, and deliver work with greater confidence.
Work delivery success statistics
Good work delivery does not happen by accident. Teams are more likely to succeed when they have clear goals, strong communication, progress tracking, resource visibility, and the ability to adjust when things change.
Only 50% of projects are considered successful
According to PMI’s Step Up: Redefining the Path to Project Success with M.O.R.E., only 50% of projects fully achieve their intended outcomes. Another 37% are partially successful, while 13% fail.
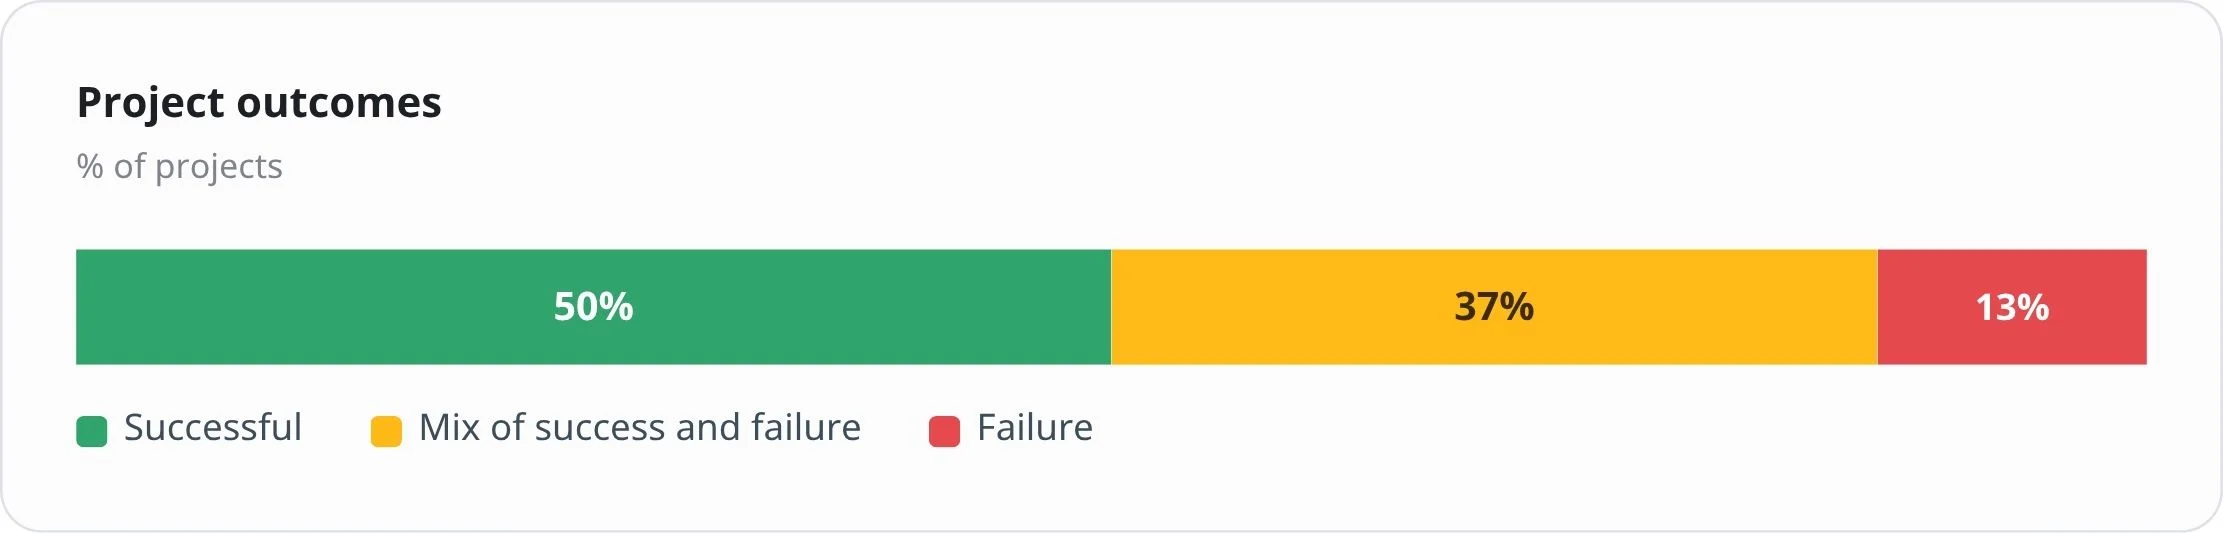
These numbers show that completing a project doesn’t necessarily mean it was successful. Organizations increasingly evaluate projects based on the value they create, rather than whether they simply meet scope, schedule, and budget targets.
Successful projects deliver value, not just completed tasks
PMI defines project success as delivering outcomes that justify the time, cost, and effort invested.
A project may finish on schedule but still fall short if it:
- Doesn’t solve the intended problem
- Fails to meet stakeholder expectations
- Produces limited business value
- Doesn’t support strategic objectives
This shift reflects a broader change in work delivery. Modern organizations measure success by outcomes instead of outputs.
Clear project vision is one of the strongest predictors of success
PMI identifies a clear project vision as one of the most important drivers of successful project outcomes.
High-performing teams typically have a shared understanding of: The project’s objectives, expected business outcomes, success criteria, stakeholder priorities.
A clear vision helps reduce unnecessary work, improve collaboration, and keep teams focused on delivering meaningful results.
45% of successful projects were once at risk of failure
One of PMI’s most interesting findings is that 45% of successful projects were considered at risk at some point during execution.
This demonstrates that project risk doesn’t automatically lead to project failure. What matters most is how quickly teams recognize problems and respond.
Project recovery is often a sign of effective project management rather than poor planning.
Key takeaway
Successful work delivery is no longer measured solely by deadlines or budgets. Organizations that consistently deliver successful projects share several characteristics. They define clear goals, track progress continuously, maintain visibility into resources, respond quickly to risks, and focus on delivering business value.
Industry-specific work delivery statistics
Work delivery looks different in every industry.
An IT team may focus on sprints, releases, and technical risks. A marketing team may focus on campaigns, approvals, and deadlines. An operations team may focus on recurring processes, resource planning, and efficiency. A logistics team may focus on routes, costs, and last-mile delivery.
Here are the most important industry-specific work delivery statistics to know in 2026.
Software development projects have the highest success rate
According to PMI’s project success research, software product development projects achieve the highest success rate among the project types included in the report.
Software teams often adopt structured delivery frameworks such as Agile, Scrum, and Kanban, allowing them to deliver work in smaller increments, review progress frequently, and respond quickly to changing priorities.
Common practices include:
- Sprint planning
- Product backlogs
- Regular stand-up meetings
- Iterative releases
- Continuous feedback
These practices improve visibility, encourage collaboration, and help teams identify issues before they affect delivery.
Here’s the breakdown by project type:
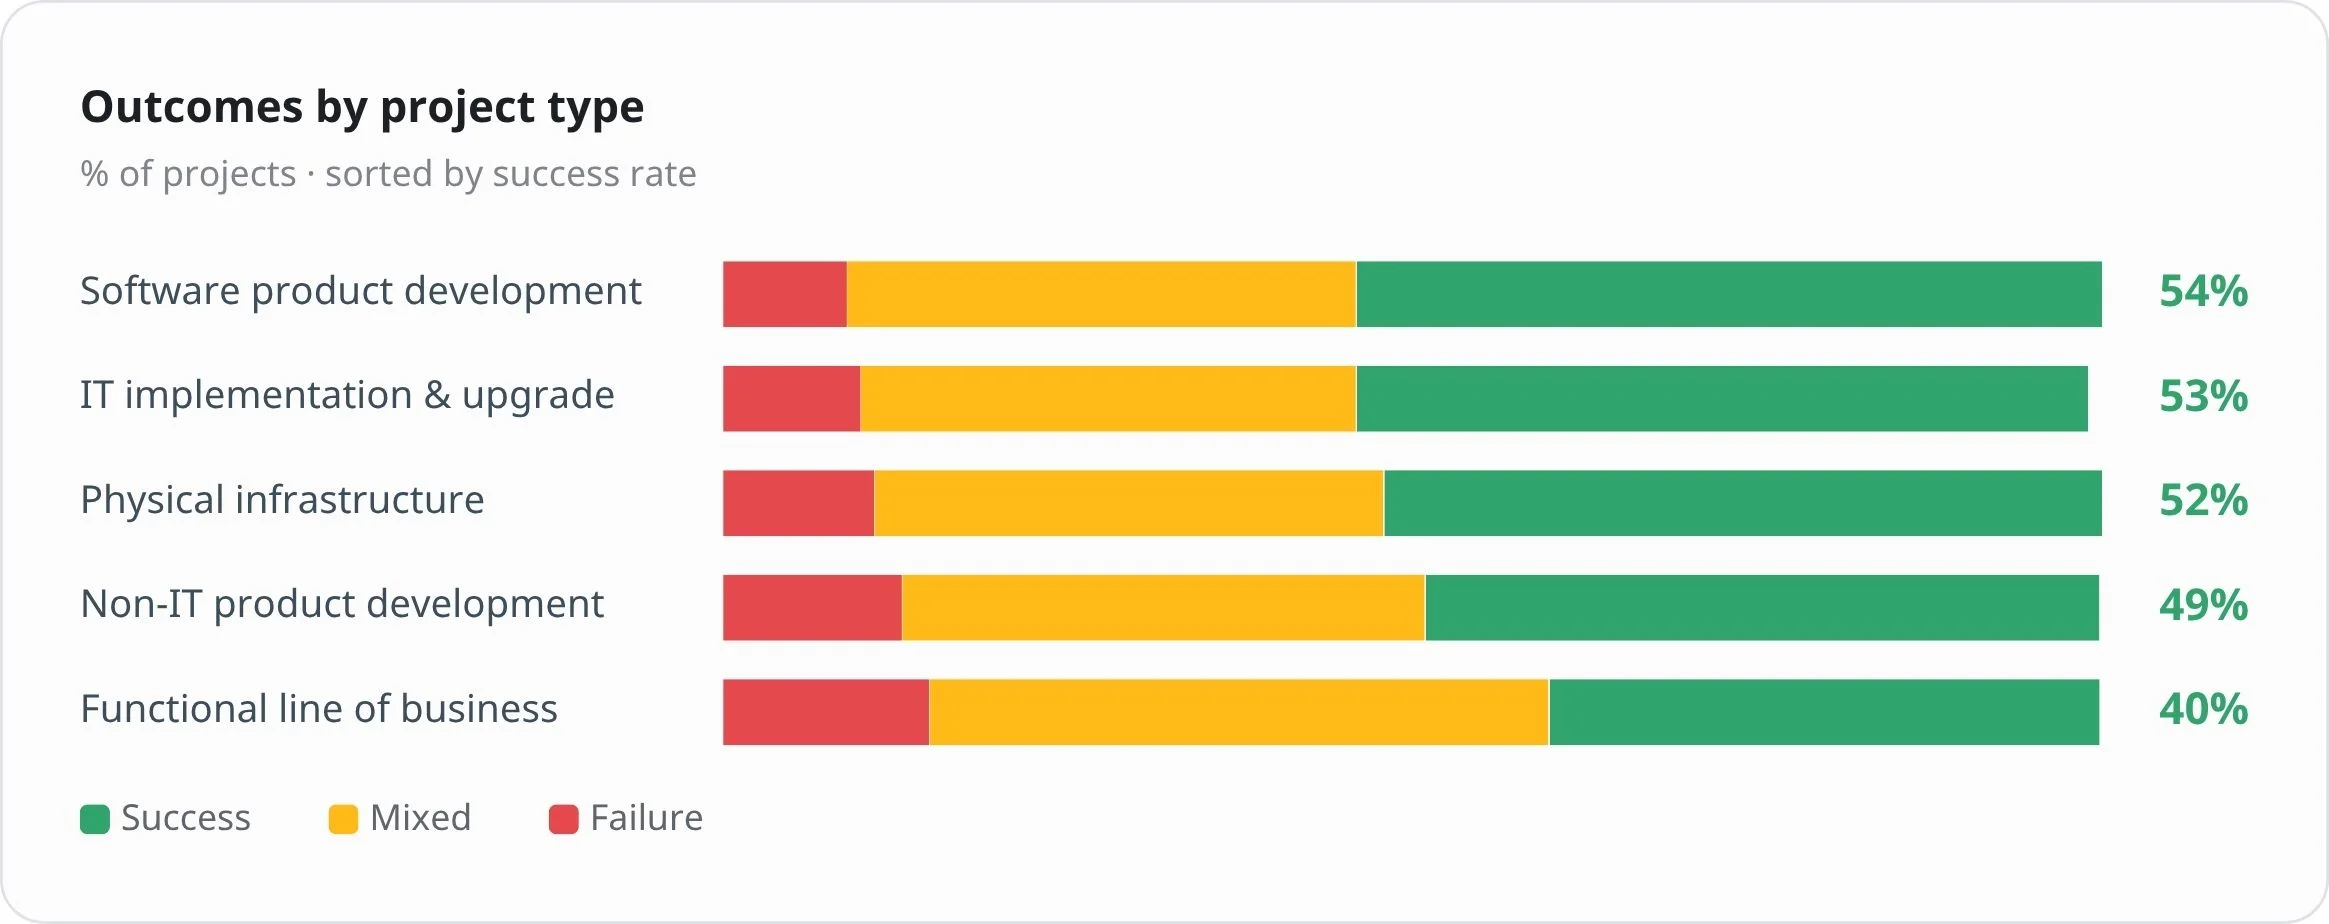
Functional line of business projects have the lowest success rate
PMI also found that functional line-of-business projects have one of the lowest success rates, with only 40% considered successful.
Unlike software projects, business initiatives often involve multiple departments, shared ownership, and competing priorities. Projects may span HR, finance, marketing, operations, and administration, making coordination significantly more challenging.
Improving communication and establishing clear accountability can significantly increase the likelihood of successful delivery.
Government projects have the highest failure rate
PMI’s project success research found that government projects had the highest failure rate among the industries included in the report.
Here’s the breakdown by industry:
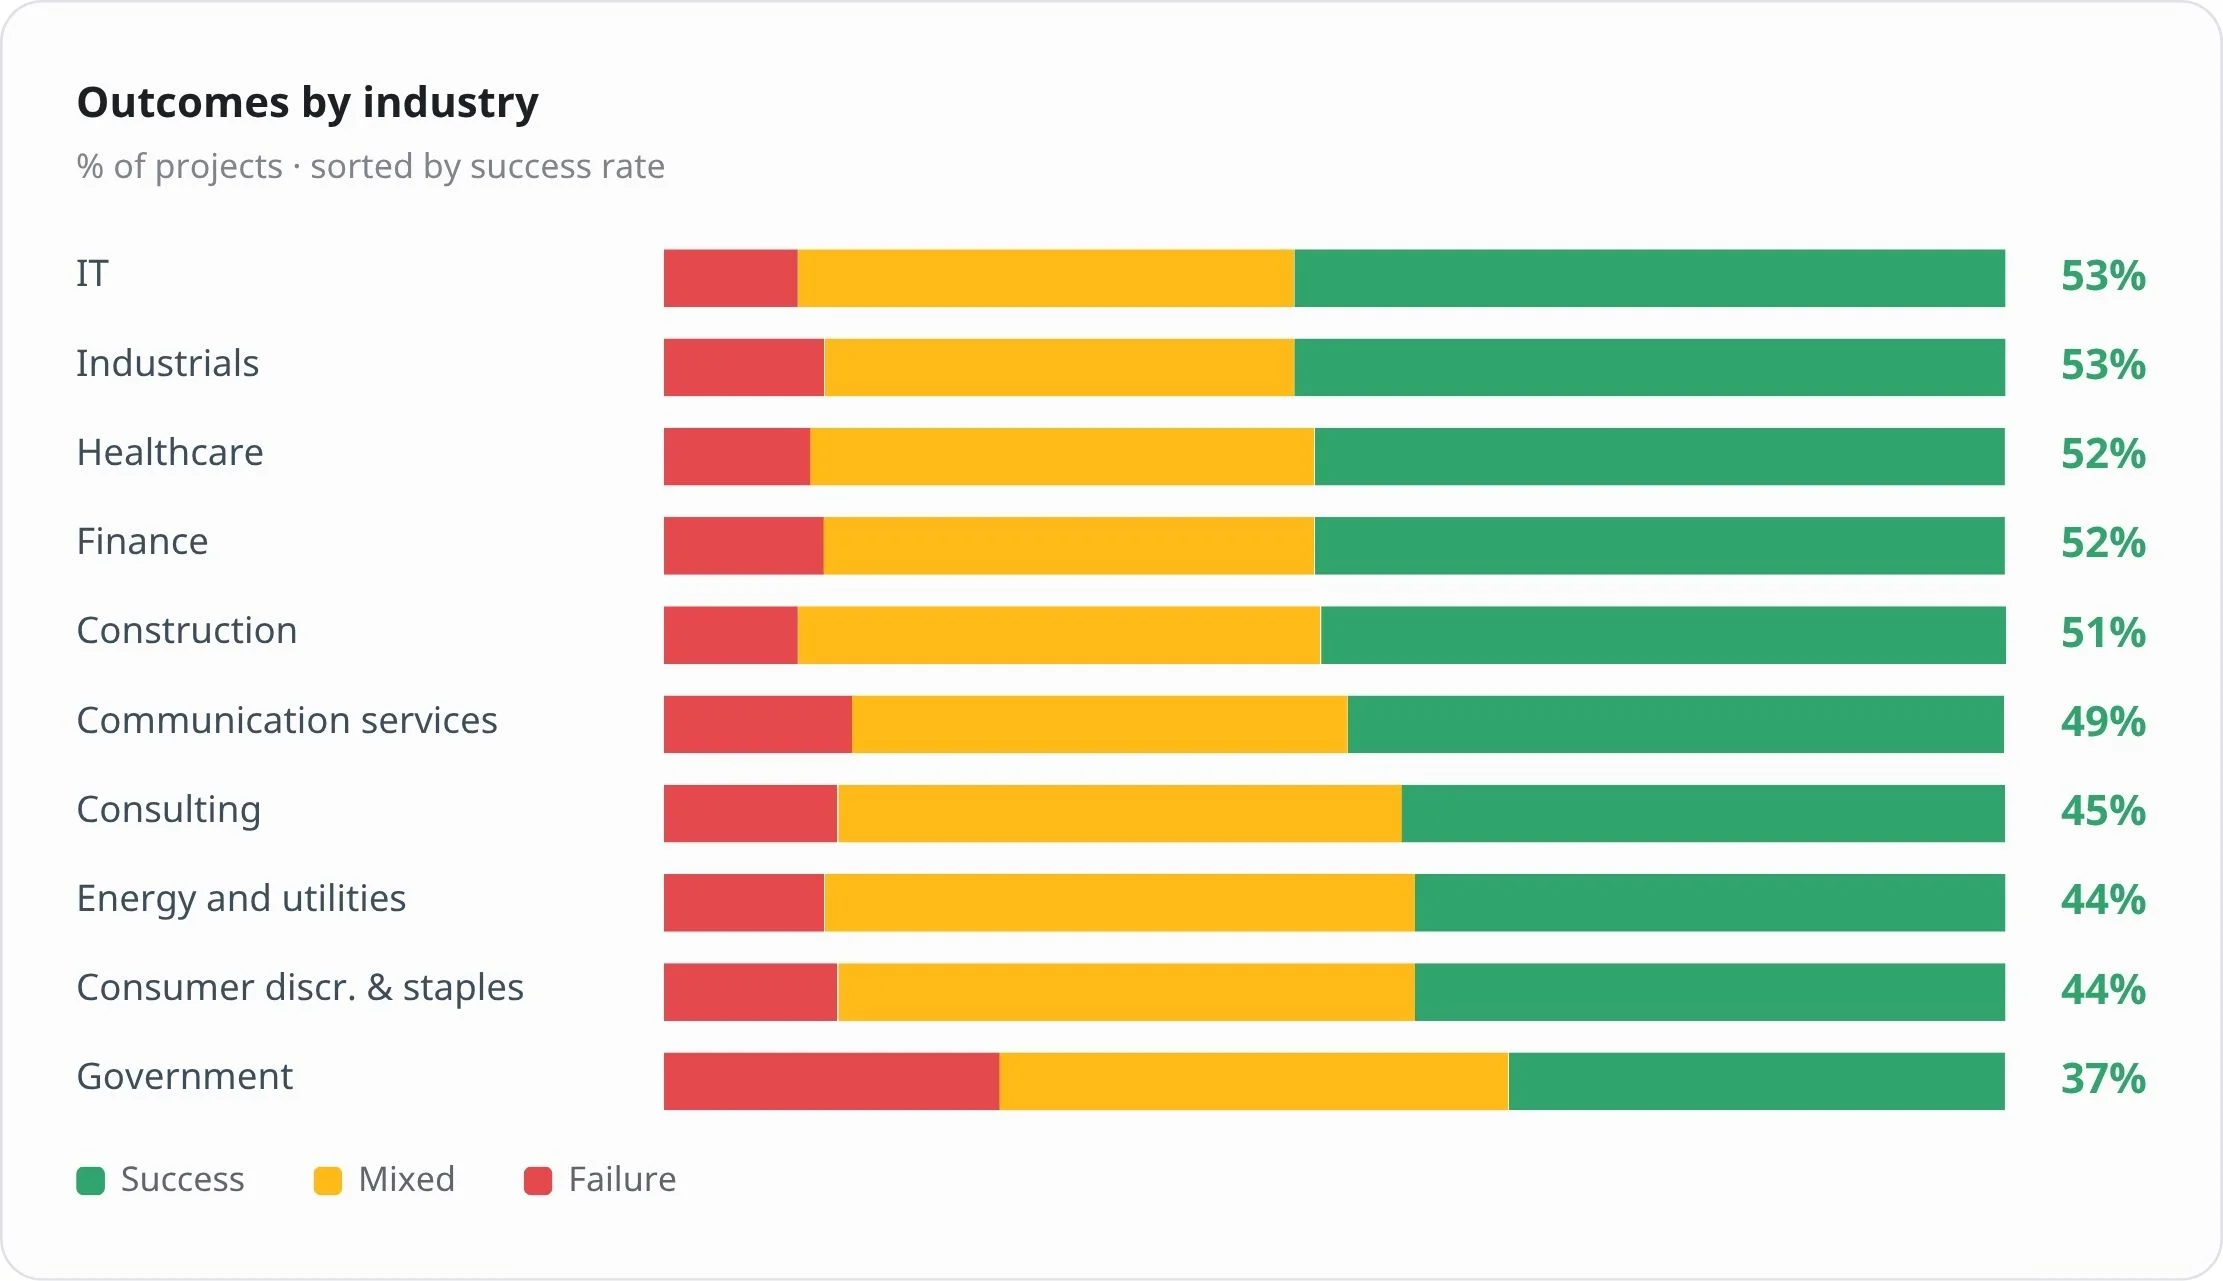
Source: PMI, Step Up: Redefining the Path to Project Success with M.O.R.E.
Government projects often involve large budgets, strict rules, many stakeholders, long timelines, and public accountability.
This can make delivery more difficult. When many people and processes are involved, teams need clear governance, strong resource planning, and reliable progress tracking to keep work moving.
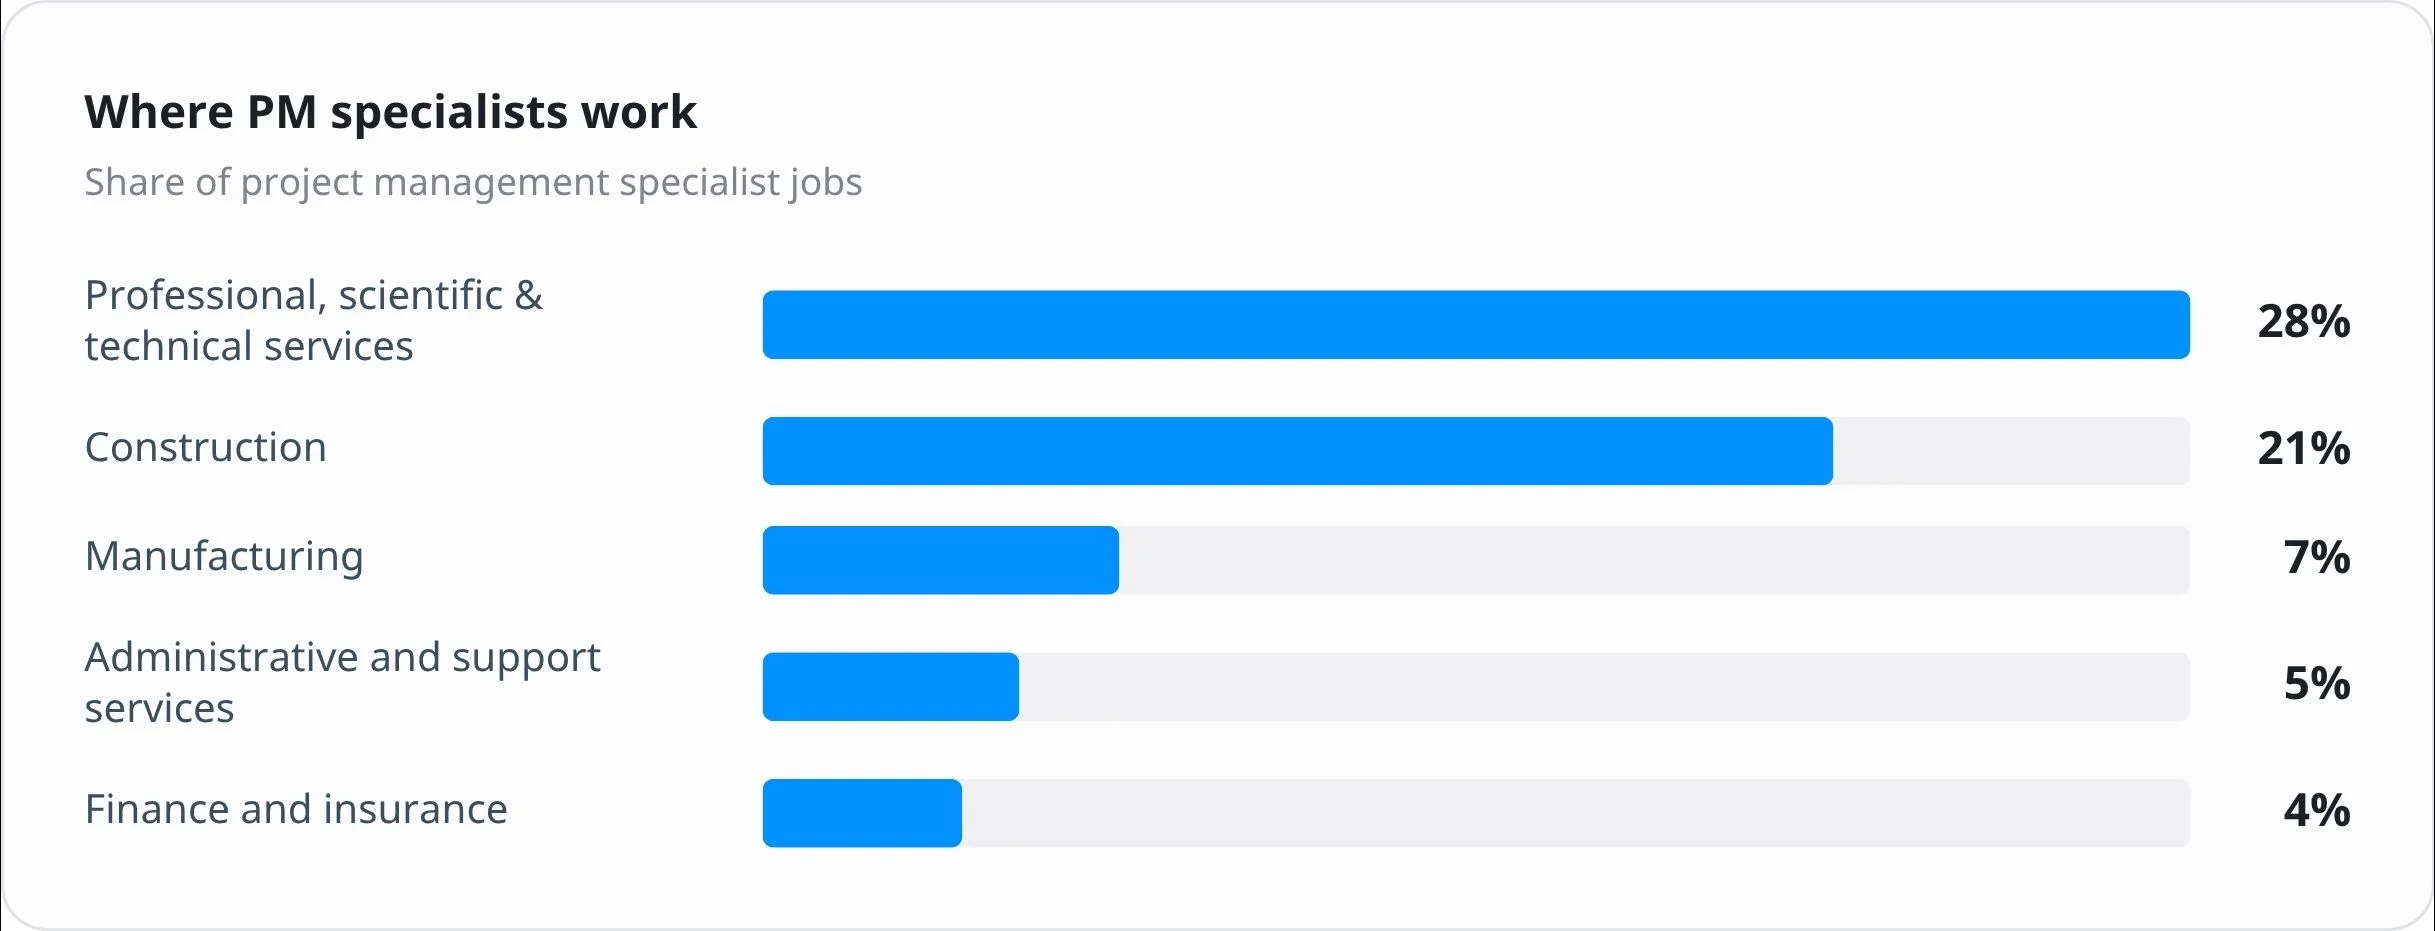
Professional and technical services employ the largest share of project management specialists
According to the U.S. Bureau of Labor Statistics, professional, scientific, and technical services employ the largest share of project management specialists.
This reflects the project-driven nature of consulting, engineering, software development, and other professional services, where teams regularly manage client deliverables, budgets, timelines, and resources simultaneously.
Success in these industries depends on balancing client expectations with internal capacity while maintaining consistent delivery quality.
Here’s the breakdown by industry:
Marketing teams manage a high volume of concurrent work
Marketing teams rarely focus on a single project. Instead, they coordinate dozens of campaigns, content initiatives, product launches, events, and creative requests simultaneously.
A typical marketing workflow may include:
- Blog articles
- Email campaigns
- Social media content
- Product launches
- Landing pages
- Design requests
- Advertising campaigns
- Performance reporting
Because so many activities run in parallel, centralized planning and streamlined approval workflows are essential for keeping projects on schedule.
Source: Capterra, Project Management Software Market Research Report.
Operations teams depend on standardized processes
Operations teams support nearly every department within an organization. Their responsibilities often include recurring requests, vendor coordination, compliance activities, reporting, and process improvement.
To improve delivery consistency, many operations teams rely on:
- Standard operating procedures
- Templates
- Checklists
- Automated workflows
- Dashboards
- Resource planning
Standardization reduces manual work, improves consistency, and enables teams to handle growing workloads more efficiently.
Source: Deloitte, 2026 Global Human Capital Trends.
Logistics teams face high costs in last-mile delivery
According to Statista, last-mile delivery accounts for approximately 53% of total shipping costs.
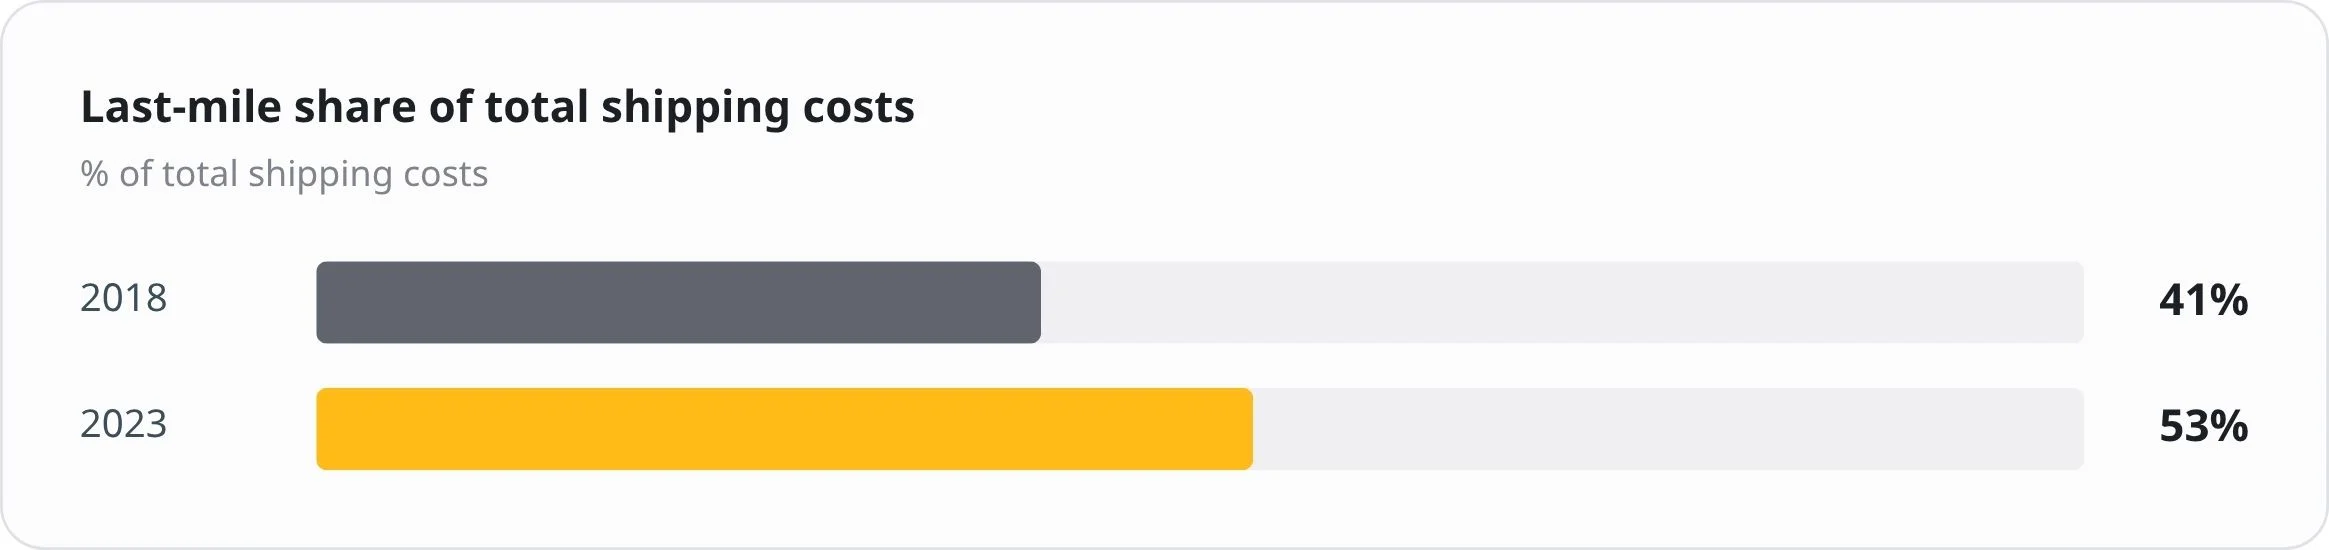
The final stage of delivery is often the most complex because organizations must coordinate drivers, optimize routes, manage delivery windows, and respond to unexpected disruptions.
To improve efficiency, logistics companies increasingly invest in:
- Route optimization
- Real-time tracking
- Workforce scheduling
- Delivery automation
- Predictive analytics
These technologies help reduce costs while improving customer satisfaction.
Independent and gig work makes resource planning more complex
According to MBO Partners, more than 72 million Americans participated in independent work in 2025.
As organizations increasingly combine full-time employees with contractors, freelancers, agencies, and gig workers, workforce planning becomes more complex.
Managers must coordinate:
- Worker availability
- Skills and expertise
- Project assignments
- Communication
- Scheduling
- Knowledge sharing
Organizations that can effectively manage both internal and external contributors gain greater flexibility without sacrificing delivery quality.
Customer support teams need strong workload visibility
Customer support teams deliver work through service requests, support tickets, escalations, and customer communications.
Without balanced workloads, teams often experience:
- Ticket backlogs
- Longer response times
- Missed follow-ups
- Employee burnout
- Lower customer satisfaction
Modern service teams use workload management and reporting tools to distribute work more evenly and maintain consistent service quality.
Source: Capterra, Project Management Software Market Research Report.
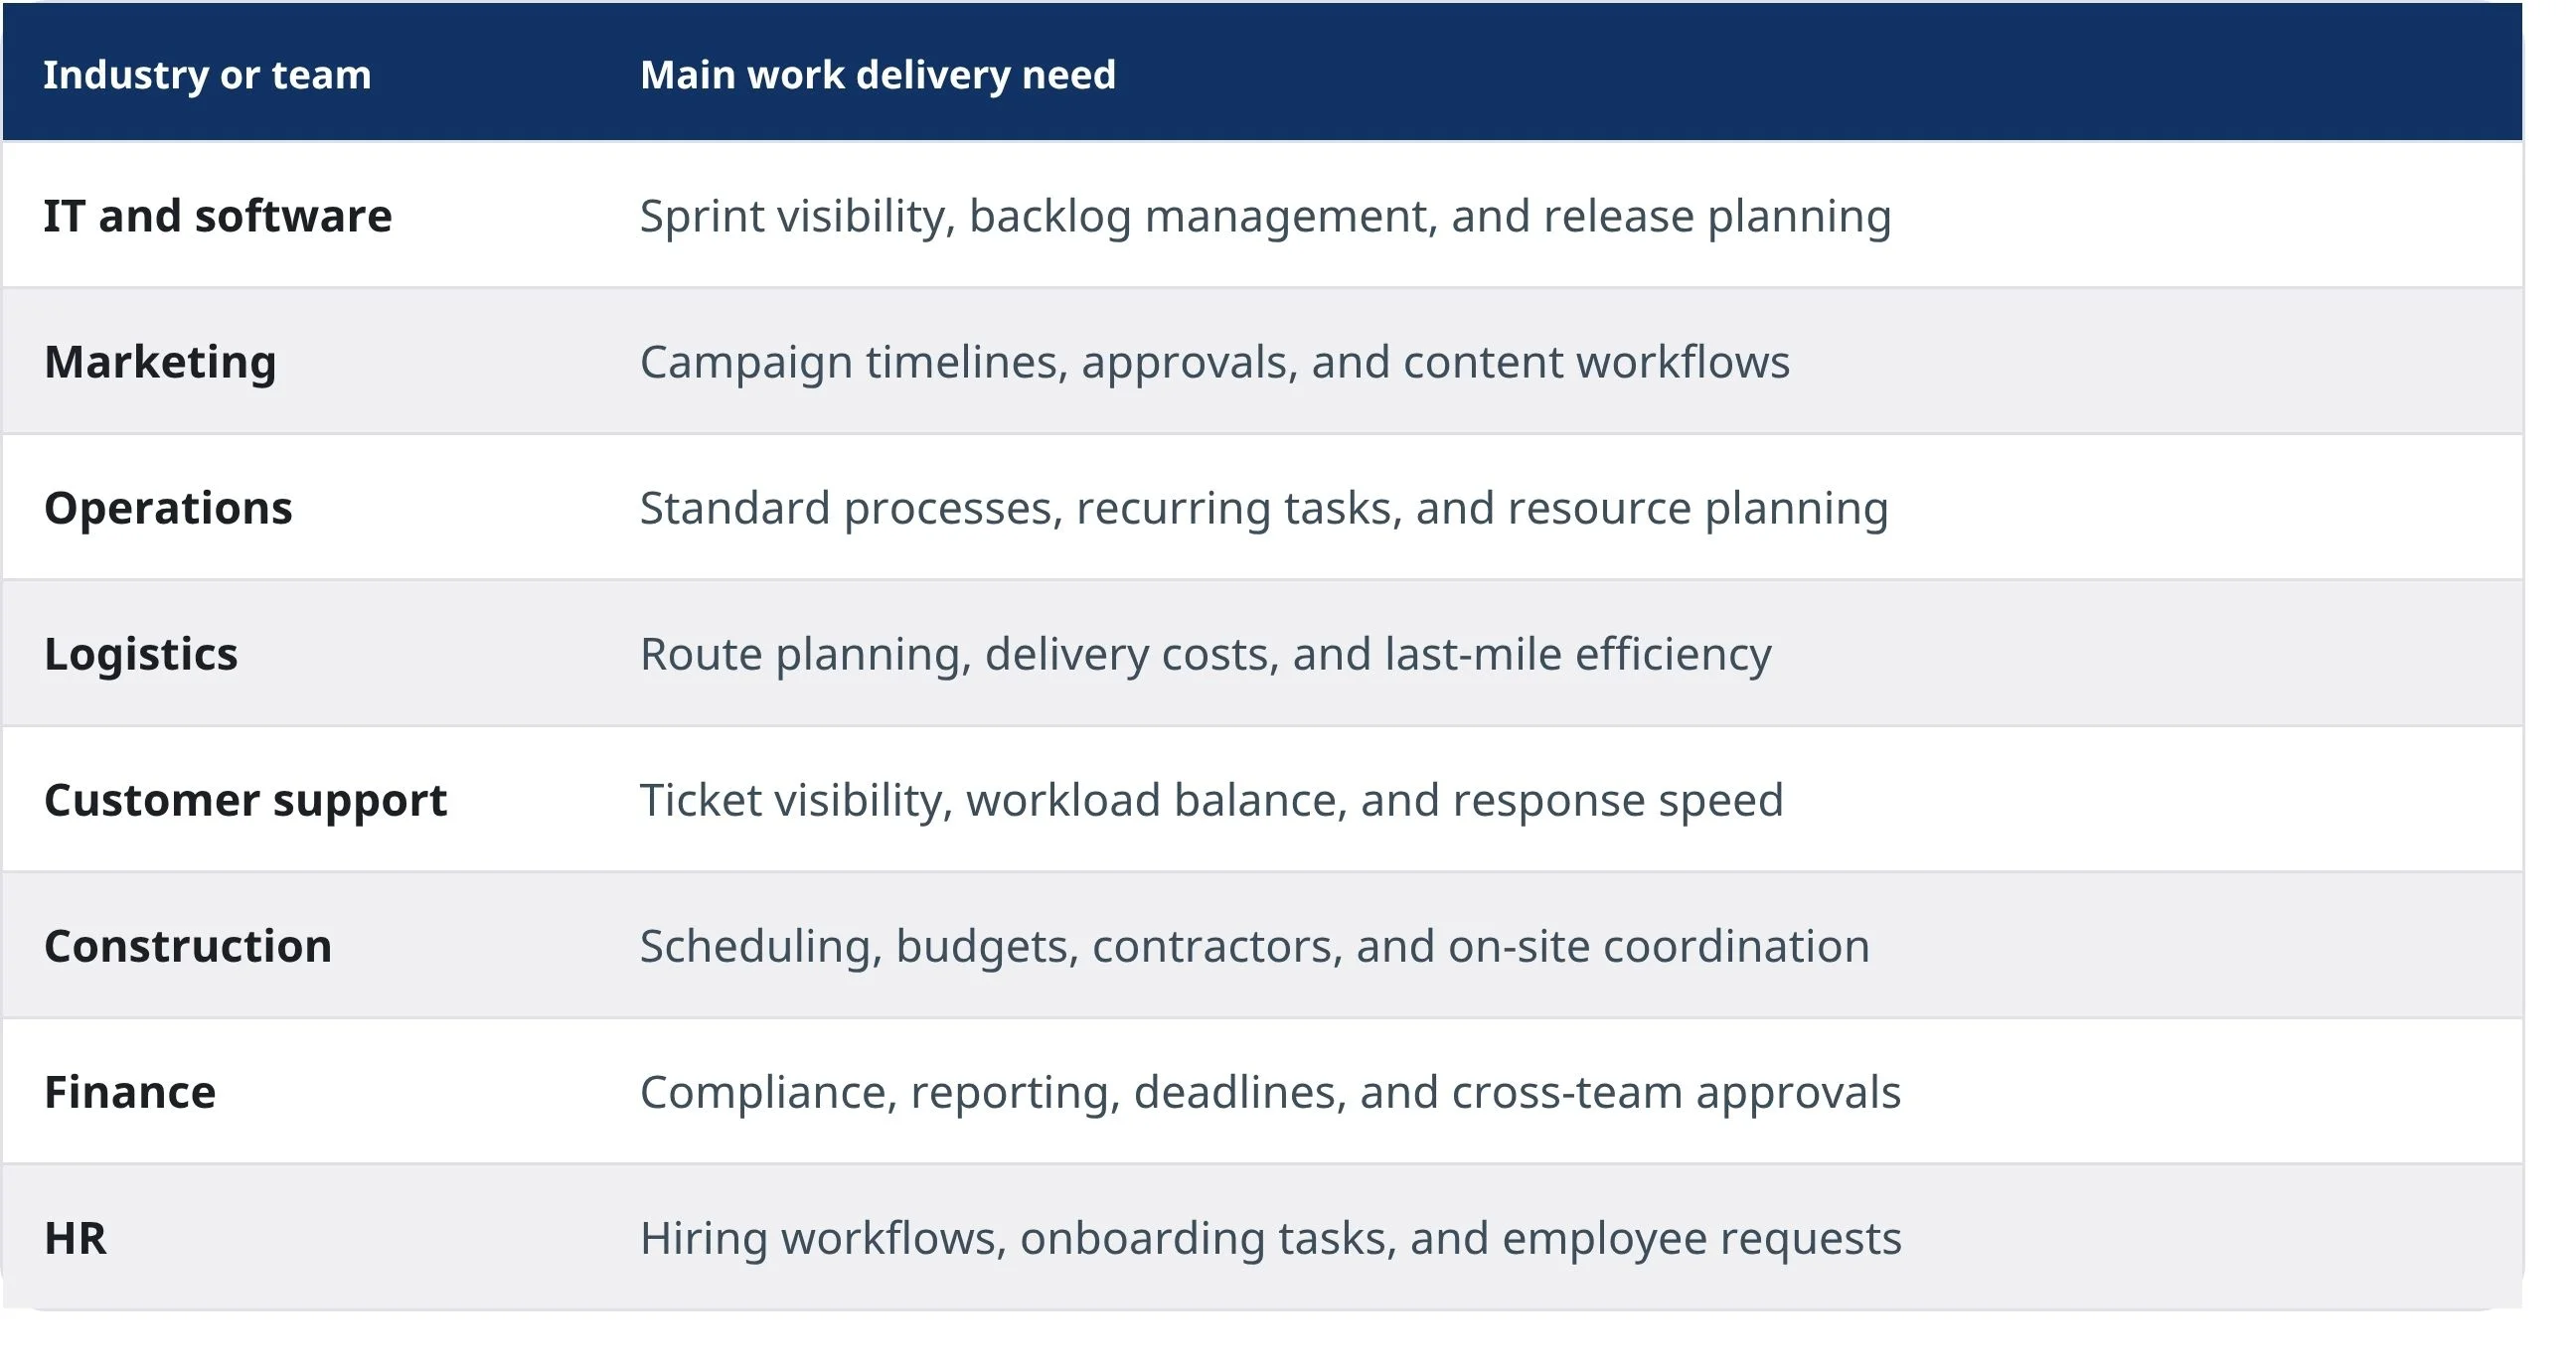
Work delivery needs are different by industry
Here’s a simple overview of how different industries and teams approach work delivery:
Close the work delivery gap with TaskFord
Understanding work delivery statistics is only the first step. Improving how work gets planned, tracked, and delivered is what drives better outcomes.
TaskFord brings projects, resources, and team collaboration together in one platform, giving organizations the visibility they need to plan effectively, stay aligned, and deliver work with confidence.
Ready to improve your work delivery? Try TaskFord for free.
Related Articles















How to Build and Manage a Product Roadmap with TaskFord



















How to Build a Connected Project Timeline in TaskFord















What Are the Best Jira Alternatives for Scrum Teams?




























How WBS Reveals Delivery Breakdown Before It’s Too Late









![How To Conduct a Profound Stakeholder Analysis [+ Free Template]](/marketing/blog/stakeholder-analysis.webp)




















What to Look for in Scrum Tools (Beyond Kanban Boards)



![Project Management Calendar for Teams and Managers [Free Templates]](/marketing/blog/project-management-calendar.webp)







How to Define Project Deliverables: A Step-by-Step Guide













![RACI Chart in Project Management: Rules & Examples [Free Download]](/marketing/blog/raci-chart.webp)




















![7 Must-Have Project Management Documents Every PO Should Know [Free Templates]](/marketing/blog/project-management-documents.webp)













![How to Create a Winning Project Plan for IT Projects [10 Steps Included]](/marketing/blog/how-to-create-a-project-plan.webp)




![Daily Standup Best Practices: Apply AI to Organize Meetings Successfully [2026 Trends]](/marketing/blog/daily-standup.webp)







![How to Create a Project Communication Plan: Step-by-Step Guide [+Free Template]](/marketing/blog/project-communication-plan.png)


![Master Project Procurement Management in 5 Steps [Download a free plan template]](/marketing/blog/project-procurement-management.webp)






































Subscribe for Expert Tips
Unlock expert insights and stay ahead with TaskFord. Sign up now to receive valuable tips, strategies, and updates directly in your inbox.