What is a Gantt Chart? A Comprehensive Guide for Beginners
Learn what a Gantt chart is, how it works, and how to use it in project management. Explore examples, key benefits, and limitations for complex projects.
If you are a project manager or someone exploring project management, you’ve likely heard of the Gantt Chart - a tool for visualizing project timelines and breaking down projects into manageable tasks. But what exactly is a Gantt Chart, and why is it so widely used? In this article, we will delve into its definition and history, while also analyzing its advantages and disadvantages in managing complex projects. This guide is designed to be a clear and comprehensive resource for those new to project management and Gantt Charts.
Gantt Chart History
In the late 19th century, Karol Adamiecki, a Polish engineer, introduced the “harmonogram”, an early tool designed to visualize workflows and timelines. However, this innovation remained relatively obscure outside Poland. Decades later, in the early 20th century, Henry Gantt, an American engineer, developed his version, which became widely recognized and adapted for use in various industries, eventually becoming synonymous with his name.
Initially crafted by hand, early Gantt charts were labor-intensive and challenging to update. The advent of modern technology transformed them into dynamic tools, easily created and modified using project management software. Modern Gantt charts go beyond scheduling, incorporating features like task dependencies, resource allocation, and progress tracking, making them indispensable for efficient project management.
What is a Gantt Chart?
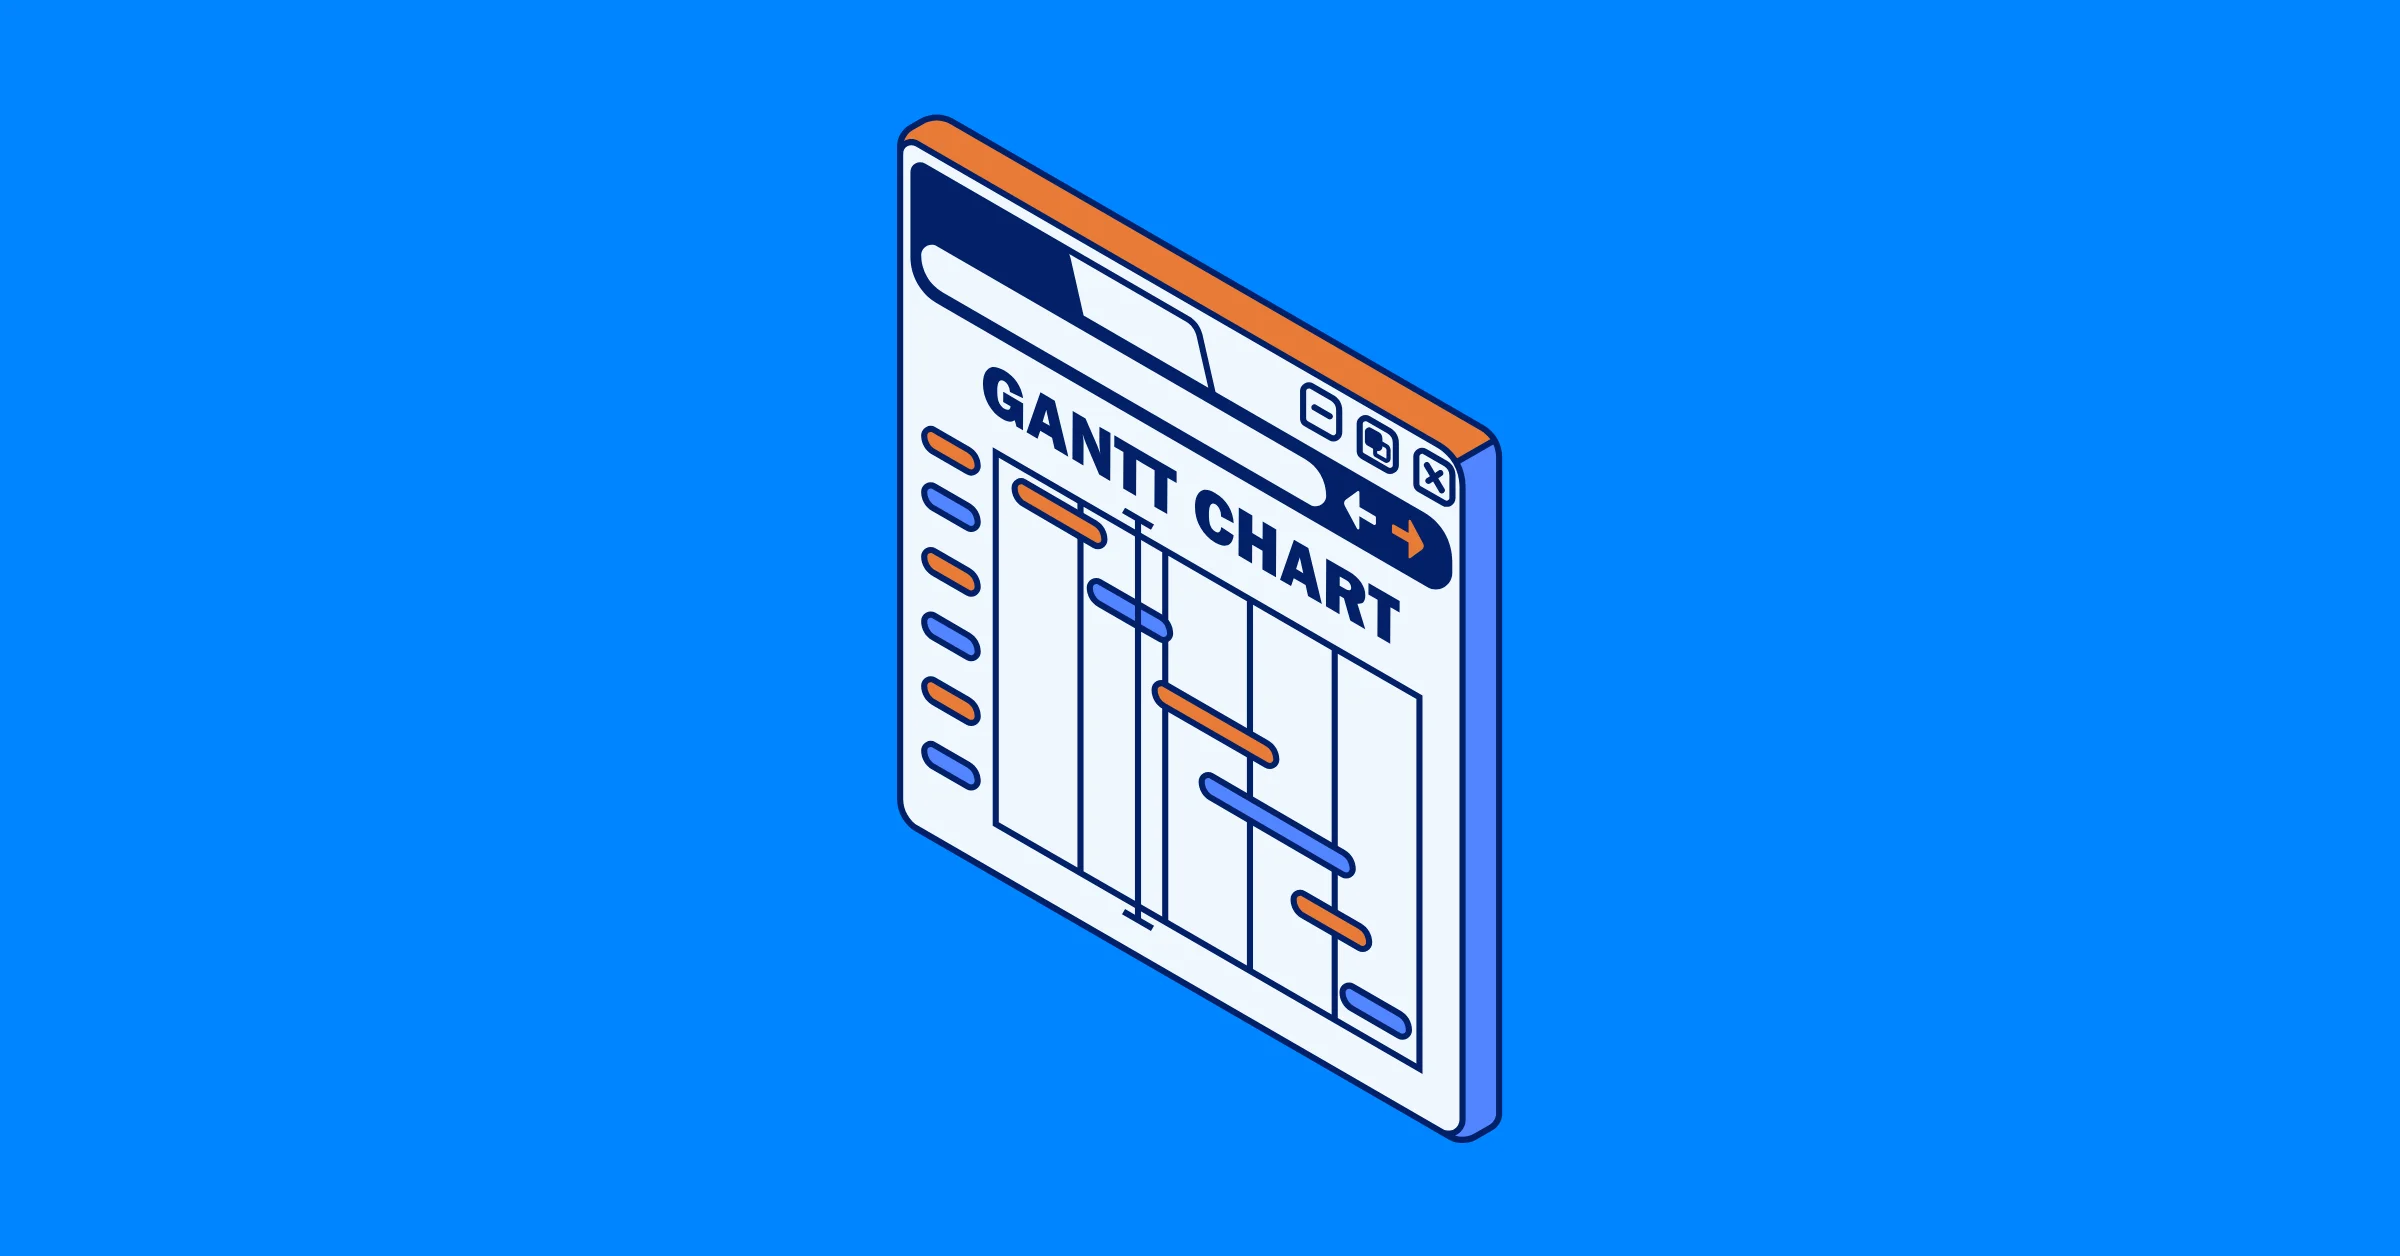
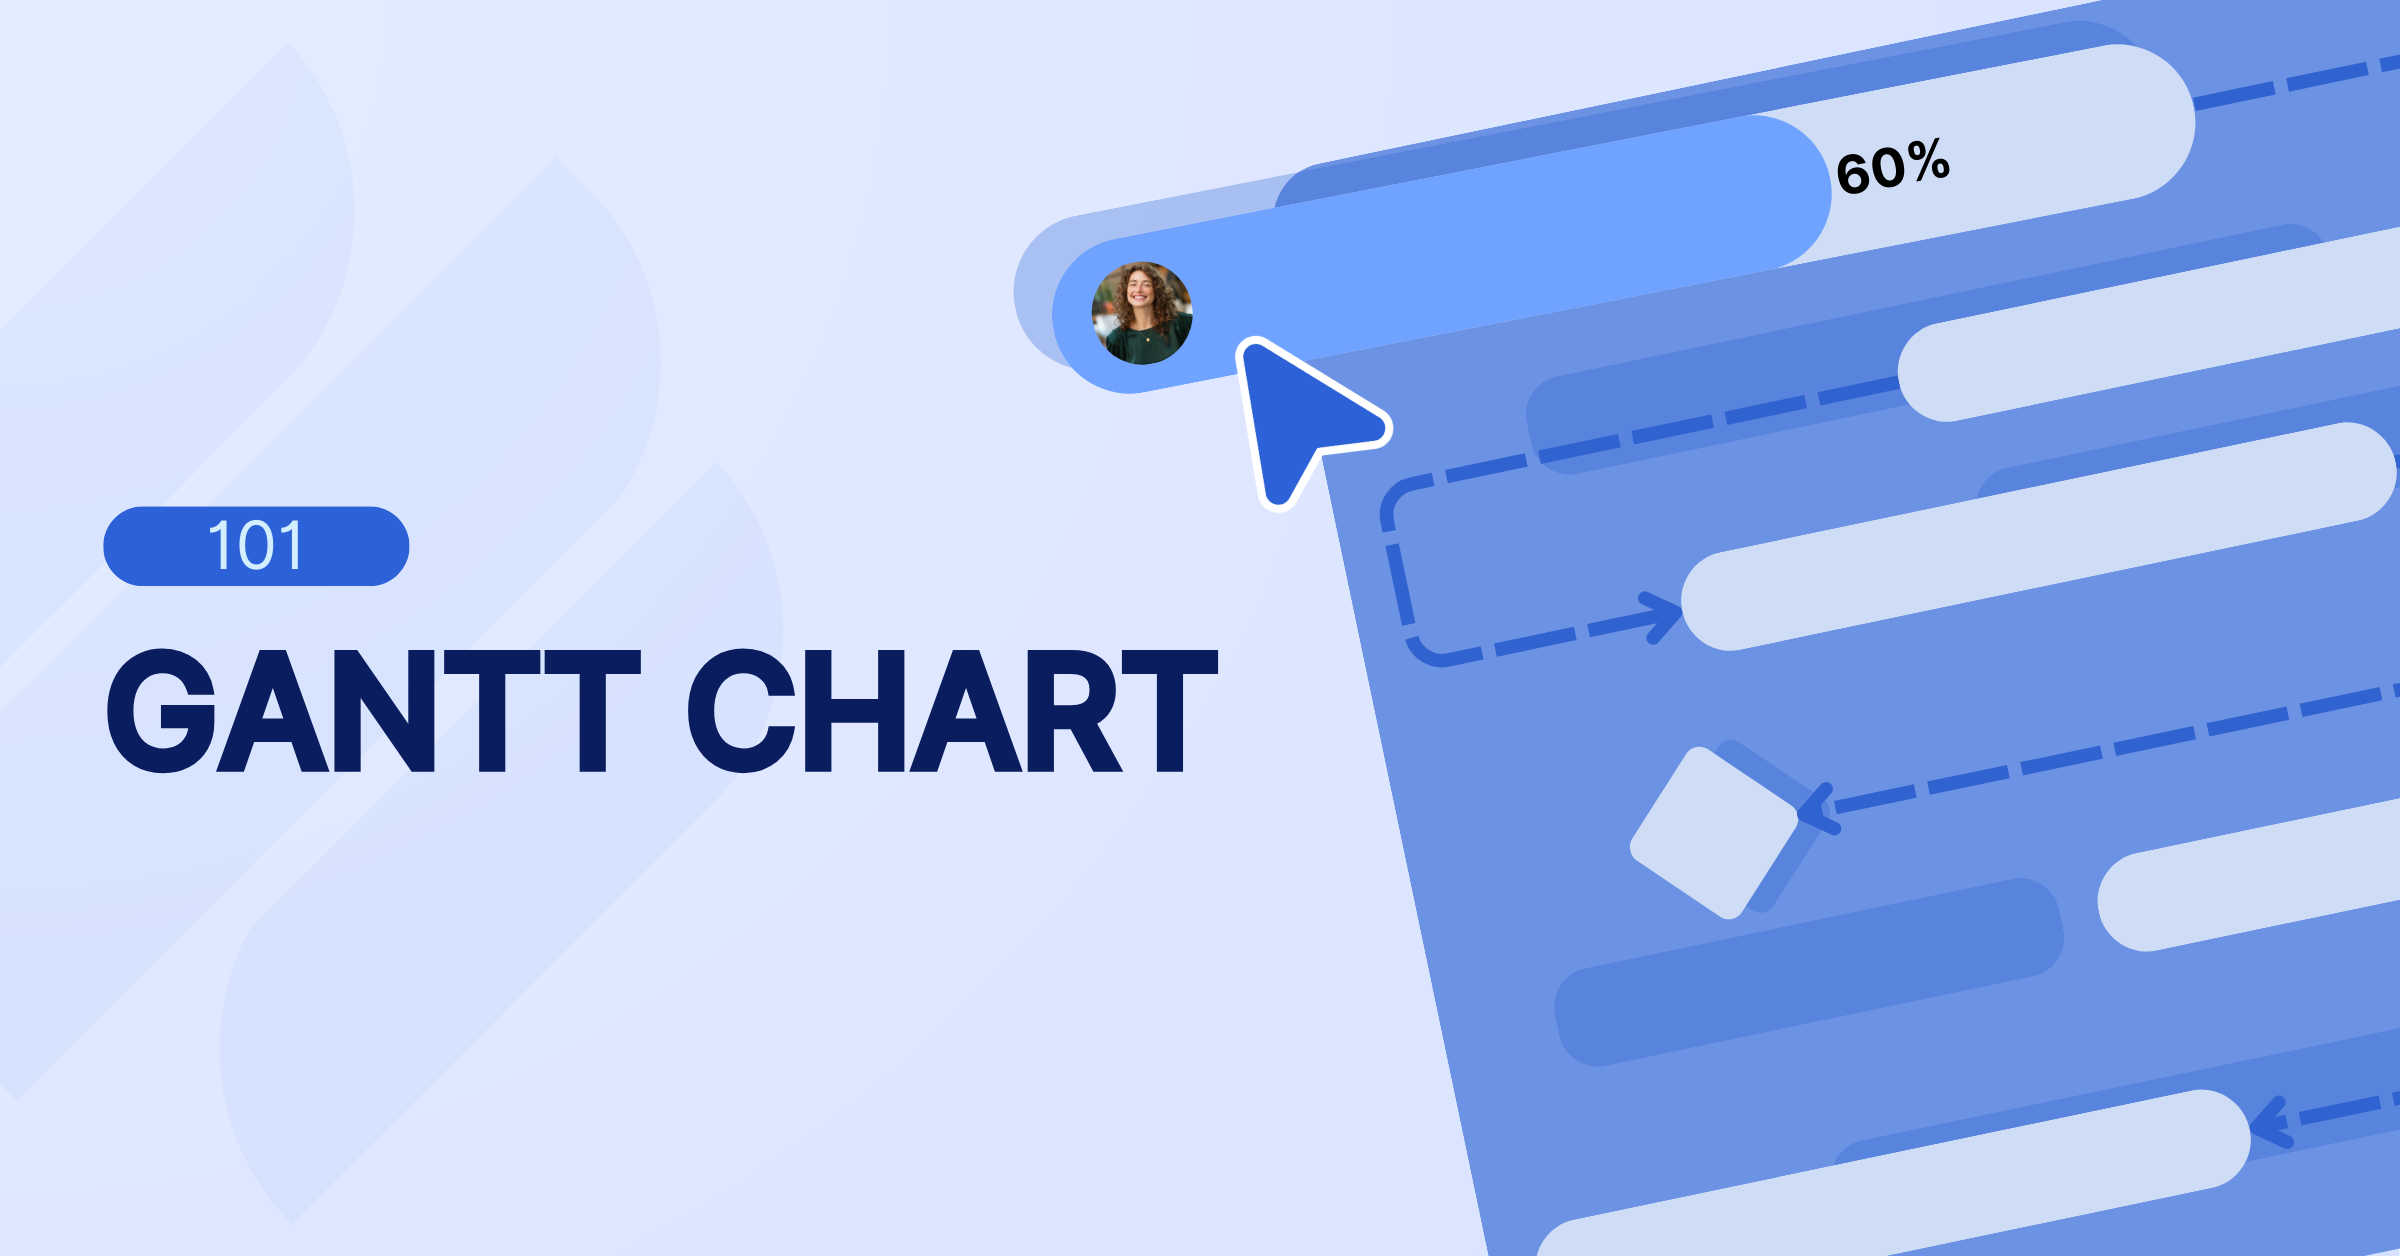
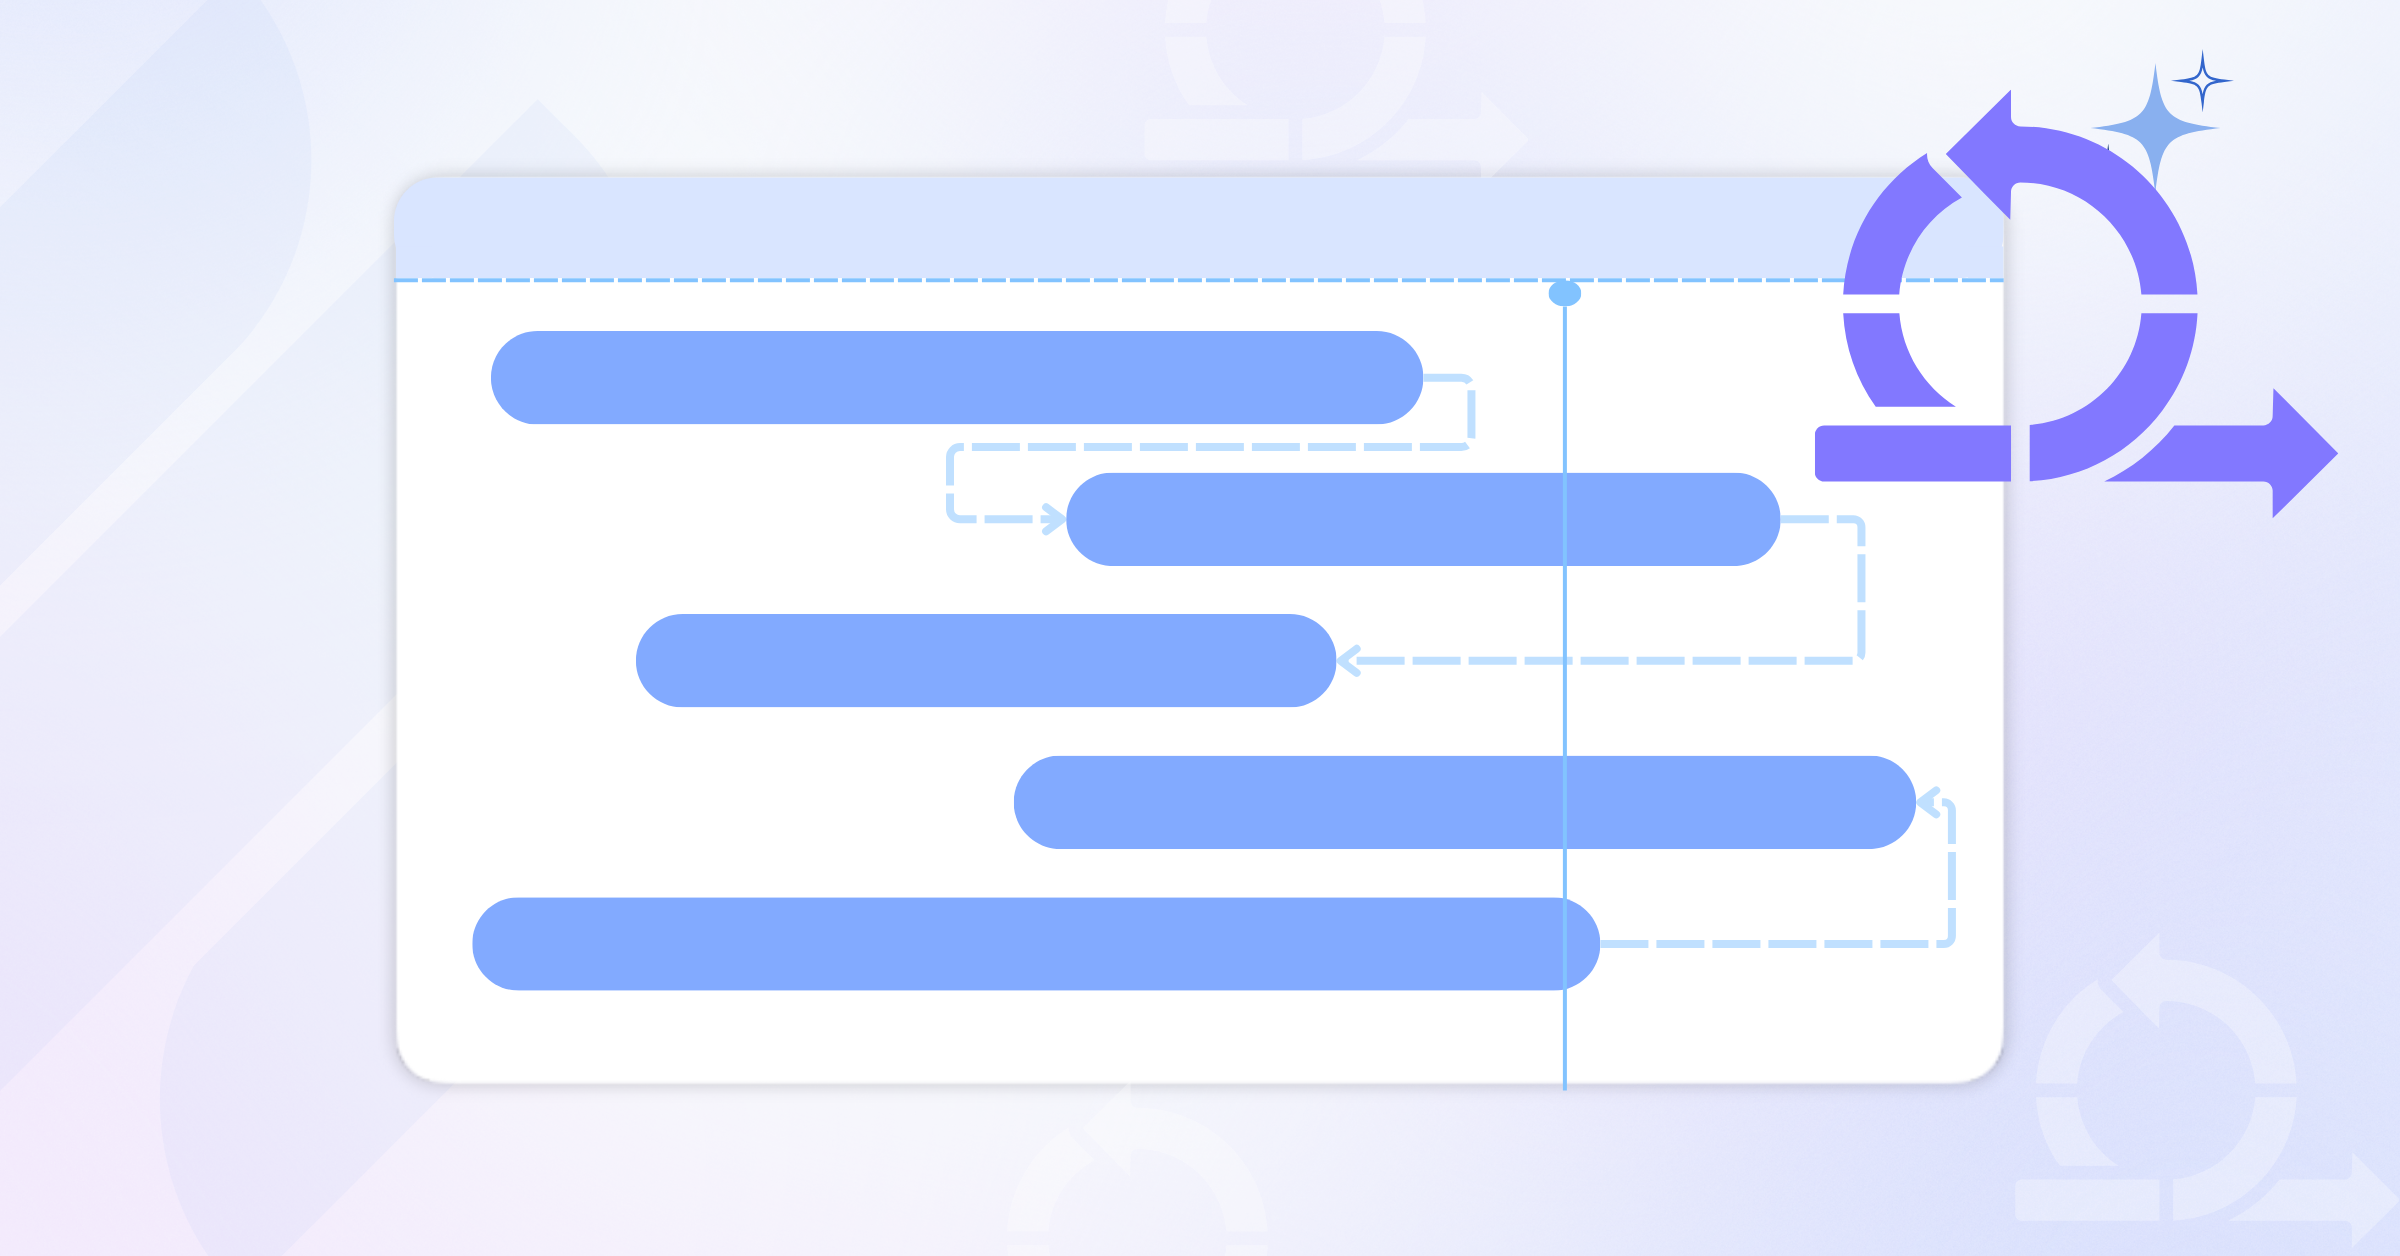
A Gantt chart is a visual tool used in project management to assist with planning, scheduling, and tracking project tasks. A Gantt chart is defined as a graphical representation of tasks against time. It visually organizes a project’s timeline, illustrating the start and end dates of tasks, their progress, and dependencies.
It allows project managers to break down the project into individual, hierarchical tasks while still maintaining a clear and detailed view of each task, such as the assignee, start date, and end date.
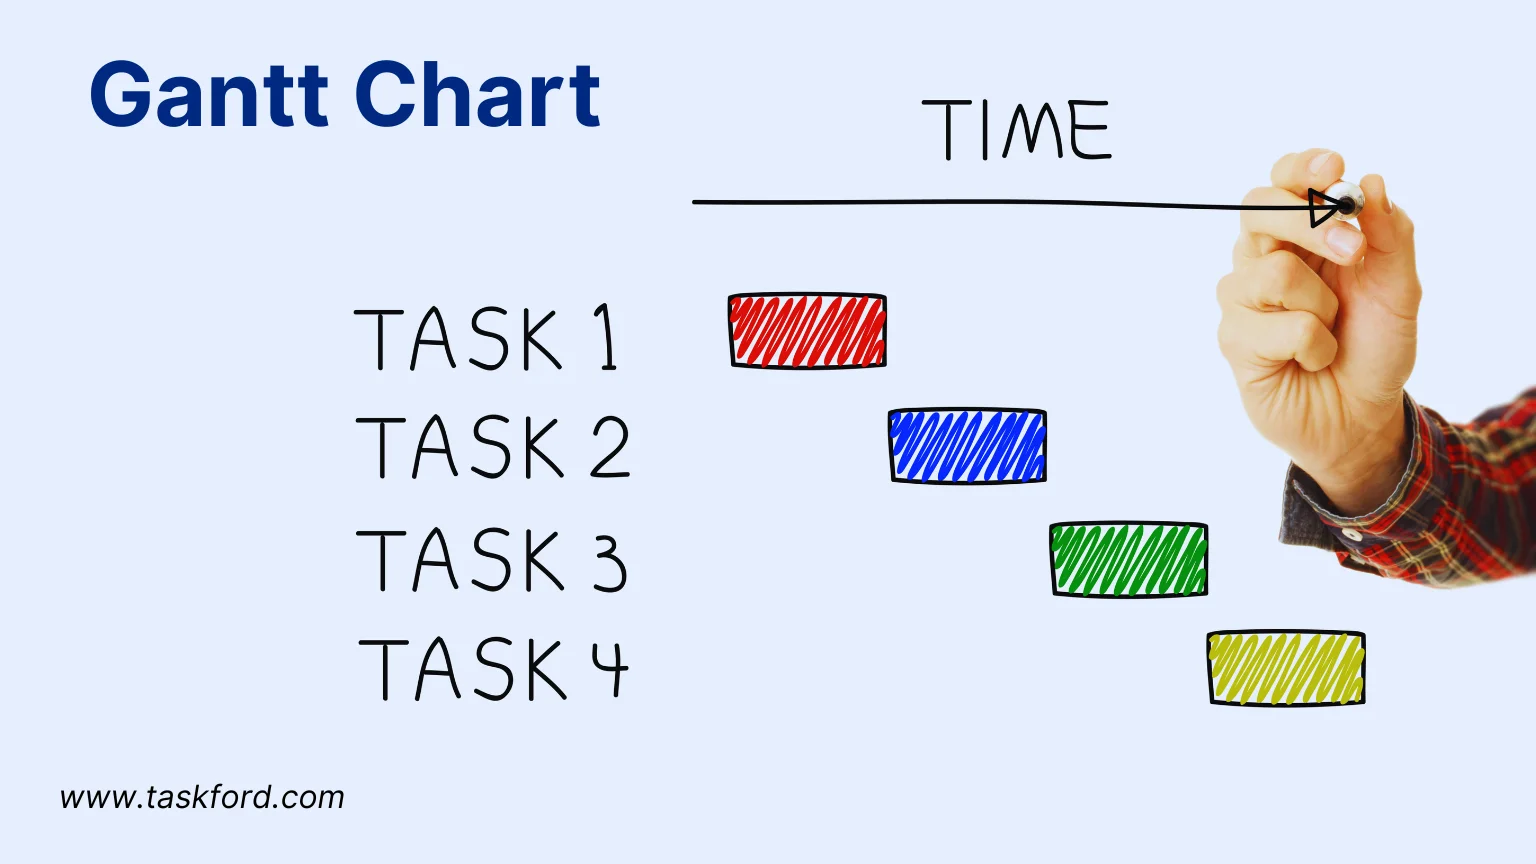
By transforming timelines and task details into an easily digestible format, the Gantt chart is a cornerstone of project management, enabling teams to maintain clarity, efficiency, and alignment throughout the project lifecycle.
Key Components of a Gantt Chart
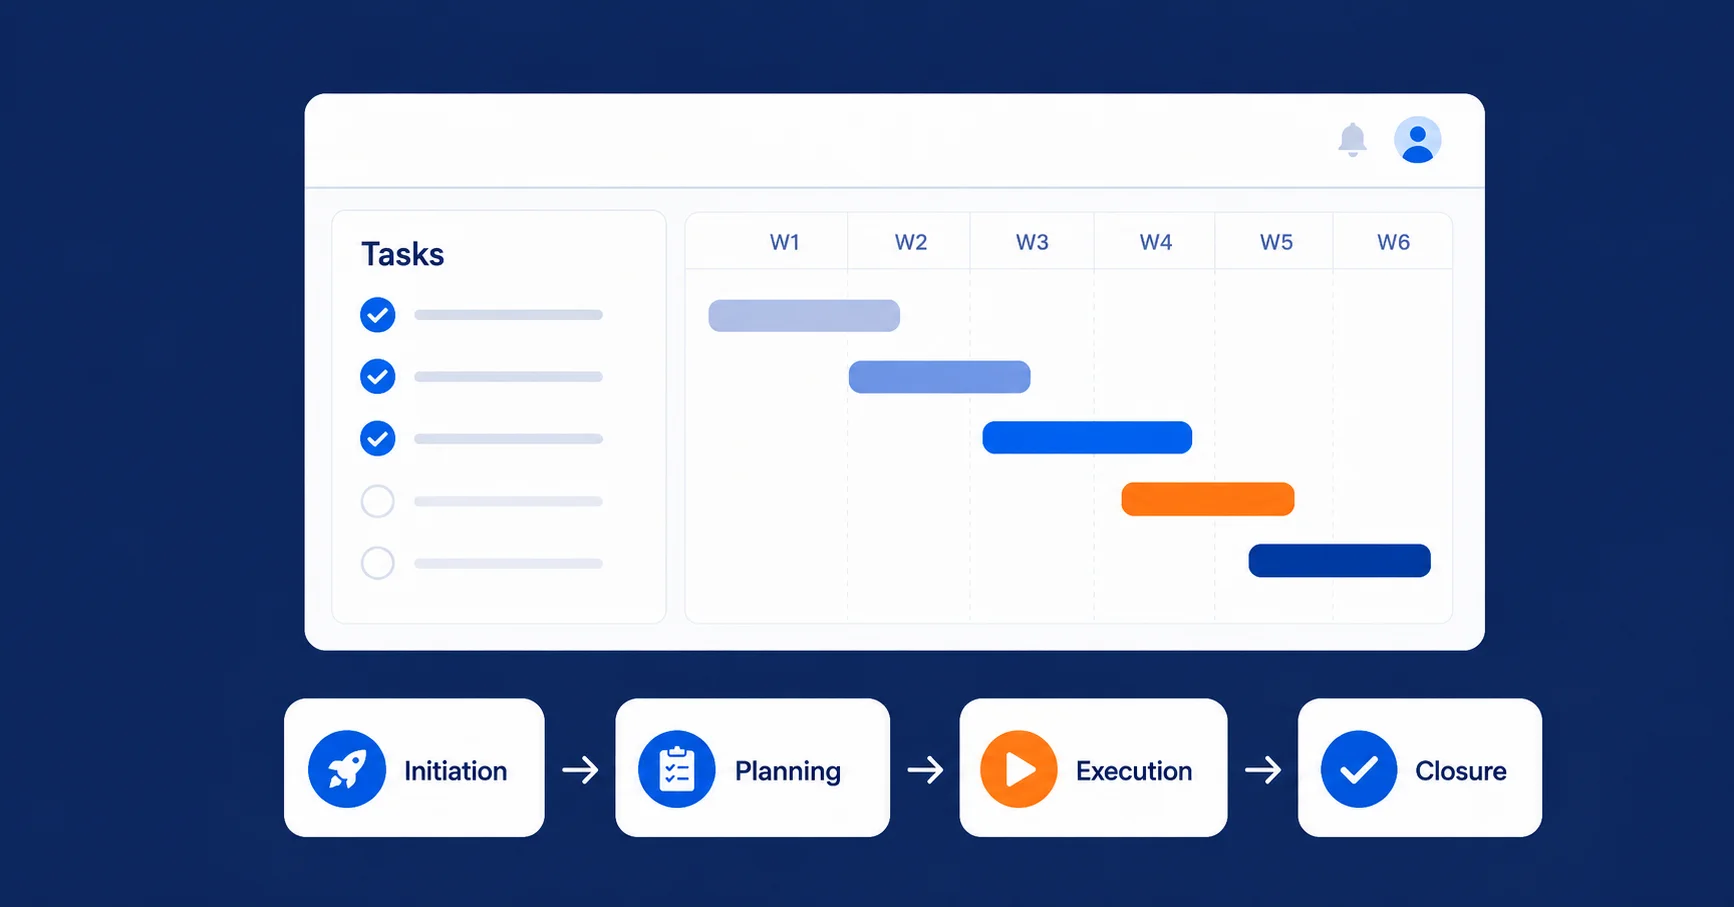
Gantt charts can vary in complexity and depth, but they always include three main components:
- Activities or Tasks: listed along the y-axis to outline what needs to be completed.
- Timeline: displayed along the x-axis at the top or bottom of the chart, indicating the project’s duration.
- Gantt Bars: horizontal bars that visually represent the duration of each task based on its start and end dates.
Beyond these core elements, more advanced Gantt charts may also feature additional components such as dependency lines, milestones, the critical path, and a baseline.
What is a Gantt Chart Used For?
Gantt charts are widely used in project management, especially in waterfall projects and construction projects where tasks must be carried out in a strict sequence to ensure project deadlines are met. In most projects, Gantt charts are used to:
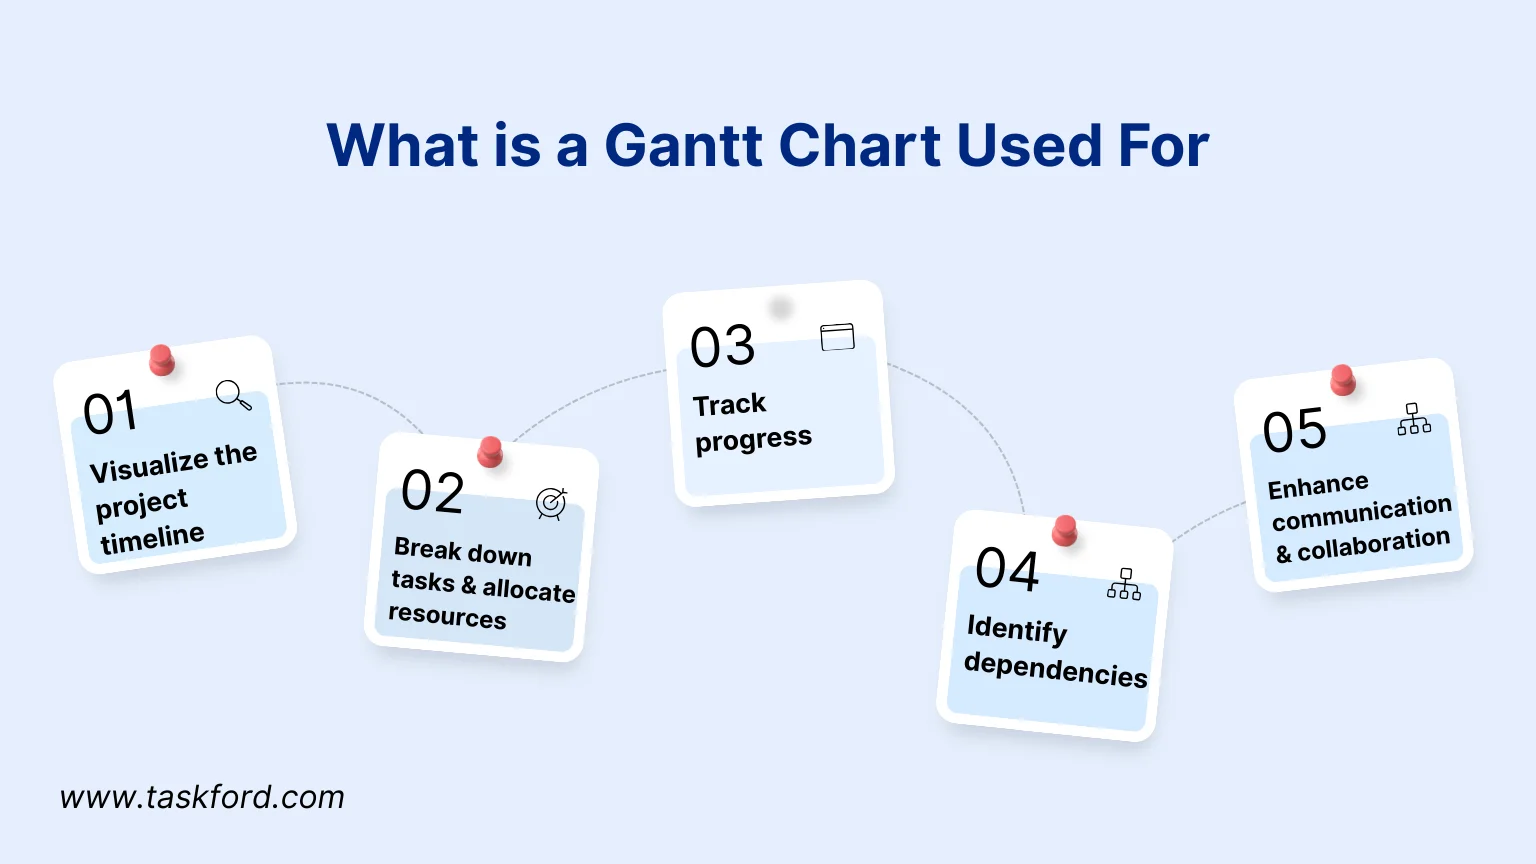
1. Visualize the project timeline
Imagine your project consists of hundreds or even thousands of individual tasks—each assigned to different resources, with its own start and end date, and interdependent on other tasks. Without a Gantt chart, keeping track of when each task starts and ends would quickly become overwhelming and confusing. With clear horizontal bars, Gantt charts allow you to grasp the entire project timeline at a glance, preventing disorientation as you move from task to task.
2. Break down tasks and allocate resources
Projects often involve multiple resources working together, requiring project managers to break down tasks for easier assignment. Gantt charts make it possible to decompose a project into smaller, hierarchical tasks while keeping timelines visible, ensuring everyone involved has a clear understanding of what they are responsible for.
3. Track progress
A project’s overall progress depends on the progress of its tasks. As a project manager, you must continuously monitor task completion to ensure the project stays on schedule and meets its deadlines. With a Gantt chart, you can track the status of individual tasks. Some tools even automatically “roll up” the progress of smaller, lower-level tasks into higher-level ones, ultimately reflecting the overall project progress.
4. Identify dependencies
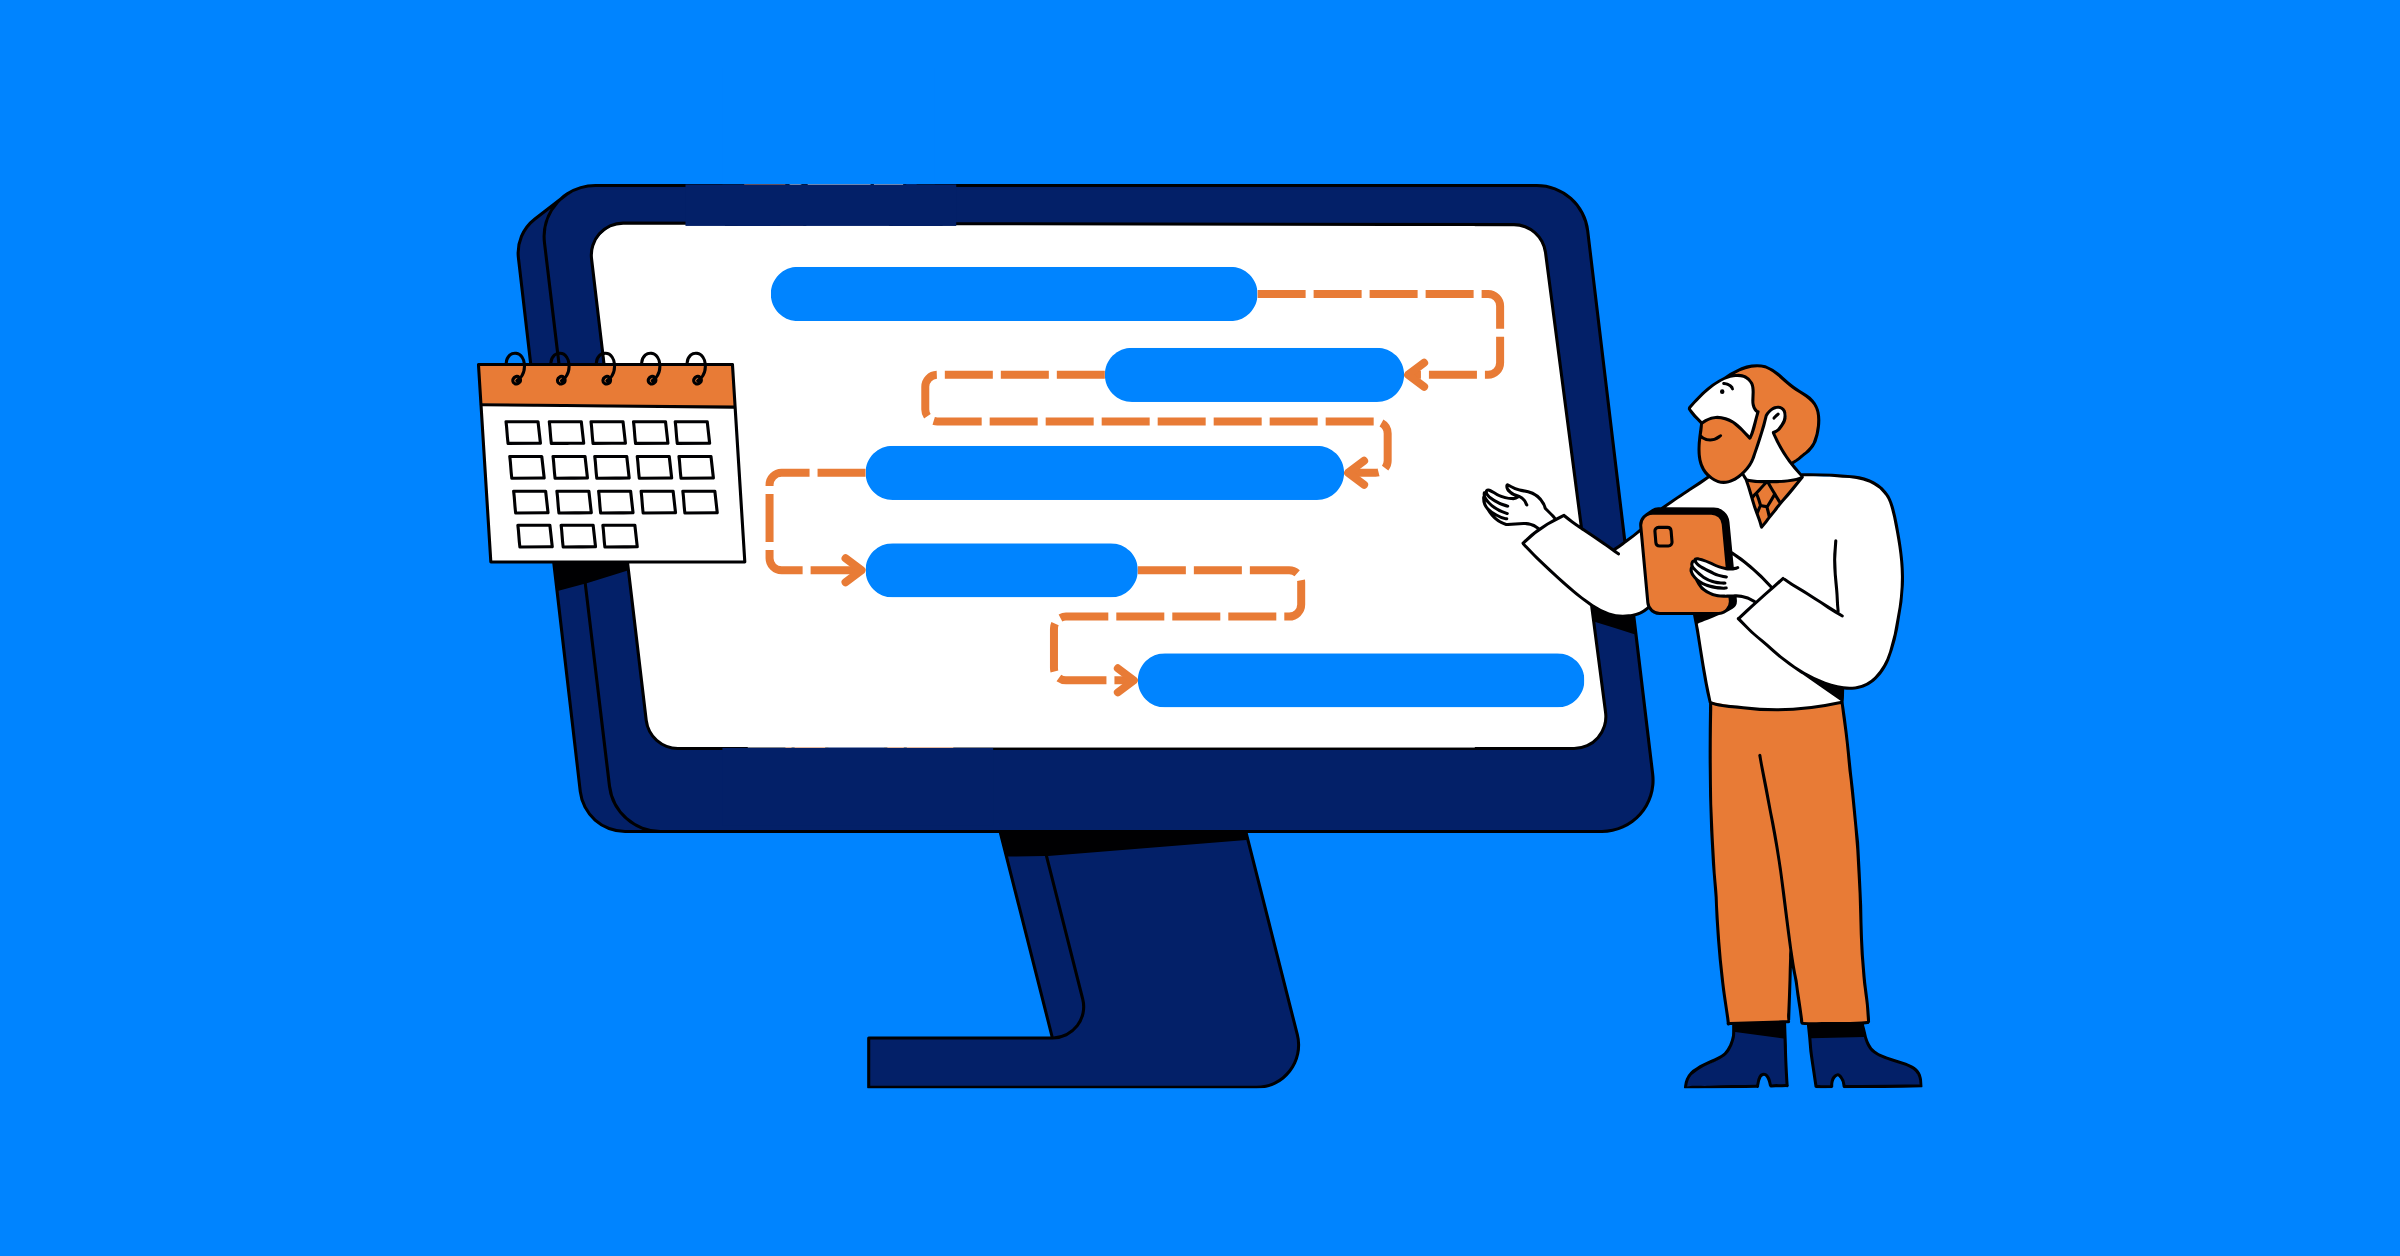
In any project, tasks are often dependent on one another. Tracking dependencies is crucial, since a delay in one task can trigger a chain of delays that impact the entire project. Gantt charts allow you to map dependency lines directly onto the bars, making it easy to see which tasks must finish before others can start, and vice versa. This enables managers and team members to clearly understand the project timeline and prioritize accordingly.
5. Enhance communication and collaboration
Gantt charts provide a clear, visual way to share project plans and updates with stakeholders, ensuring alignment and transparency. Not only project managers, but also team members can see the timeline and current progress, keeping everyone aligned on goals and responsibilities. This fosters stronger communication and teamwork throughout the project.
Example of a Gantt Chart
The image below shows an example of a Gantt chart for a software development project. It provides a comprehensive overview of tasks, durations, statuses, and resources - all in a single view.
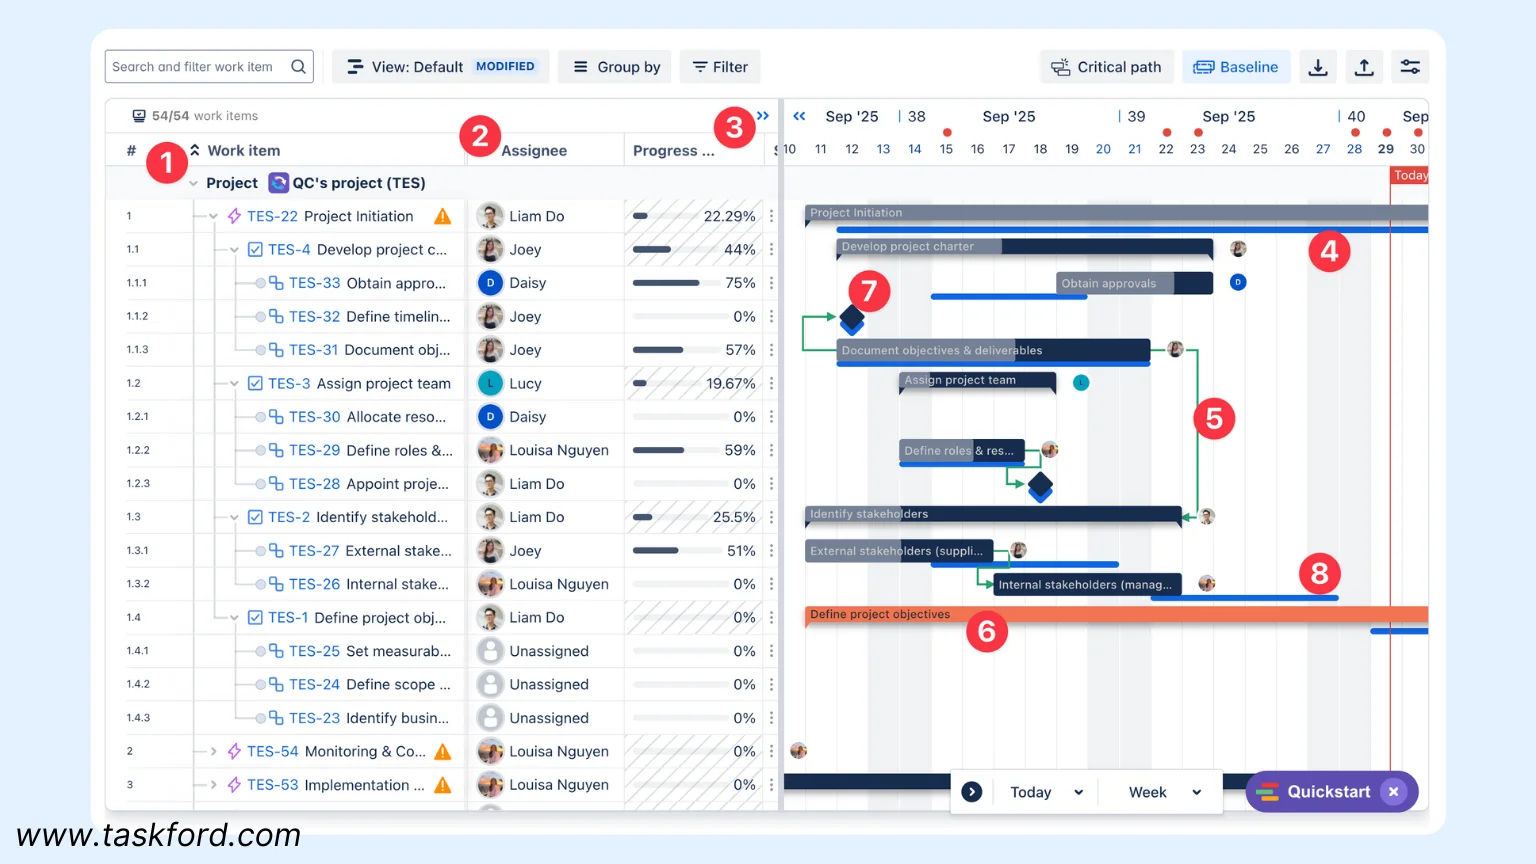
The elements displayed in the Gantt chart include:
-
Work Breakdown Structure: A Gantt chart begins with a detailed list of tasks organized under a work breakdown structure. Tasks are displayed in a task column on the left, grouped by project phases and sub-tasks.
-
Resource Allocation: Each task is assigned to a specific team member or team in the Assignee column, ensuring accountability and clarifying who is responsible for each task.
-
Task Progress: The Progress column shows the percentage of completion for each task using progress bars. This visual indicator makes it easy to identify tasks that are falling behind schedule.
-
Gantt Bars: On the right side of the chart, the timeline displays Gantt bars representing task durations. Each horizontal bar shows a task’s start and end dates, with its length proportional to the task’s duration.
-
Task Dependencies: Dependencies between tasks are represented by arrows connecting the task bars.
-
Critical Path: Critical path tasks are highlighted to indicate the sequence of activities that directly impact the project’s completion date.
-
Milestones: Milestones are marked with diamond-shaped symbols on the timeline, representing important checkpoints or deadlines within the project.
-
Baselines: The baseline feature (often displayed as shaded areas) compares the original project plan against the current progress, allowing for performance tracking and variance analysis.
What Are the Advantages and Disadvantages of a Gantt Chart?
While Gantt charts are a popular and useful tool in project management, they come with both strengths and limitations. Not every project is best managed with a Gantt chart, so choosing the right approach for your project is crucial. Below are the key advantages and disadvantages:
Advantages of Gantt Charts
- Provide a comprehensive view of tasks, durations, resources, and overall project progress in a single display, ensuring clarity and transparency for both project managers and stakeholders.
- Thanks to their visual nature, managers can easily track and plan directly within the Gantt chart without switching between different tools.
- The ability to break projects down into tasks and subtasks makes them especially suitable for sequential projects, such as construction. Dependencies are clearly displayed, helping teams prioritize effectively.
Disadvantages of Gantt Charts
- For projects with hundreds or thousands of tasks, Gantt charts can become cluttered and hard to read, often requiring excessive scrolling. While filters may help, they can reduce the effectiveness of seeing the overall picture.
- Creating and maintaining detailed Gantt charts typically requires specialized software which may involve a learning curve or additional costs.
- Gantt charts are less suitable for dynamic or highly flexible projects, where tasks and priorities frequently shift, since updating the chart can be time-consuming.
How TaskFord Makes Project Planning Easier with Gantt Charts
Creating and maintaining detailed Gantt charts often requires specialized software, which can be complex and costly. Many traditional tools have a steep learning curve and require extra resources for integration with other project management functions, leading to inefficiency and higher costs, especially for small teams.
TaskFord eliminates these pain points by offering an integrated solution that makes Gantt charts simple to use and efficient. It helps teams easily visualize project timelines, dependencies, and milestones, turning complex tasks into manageable workflows and keeping projects organized and on track.
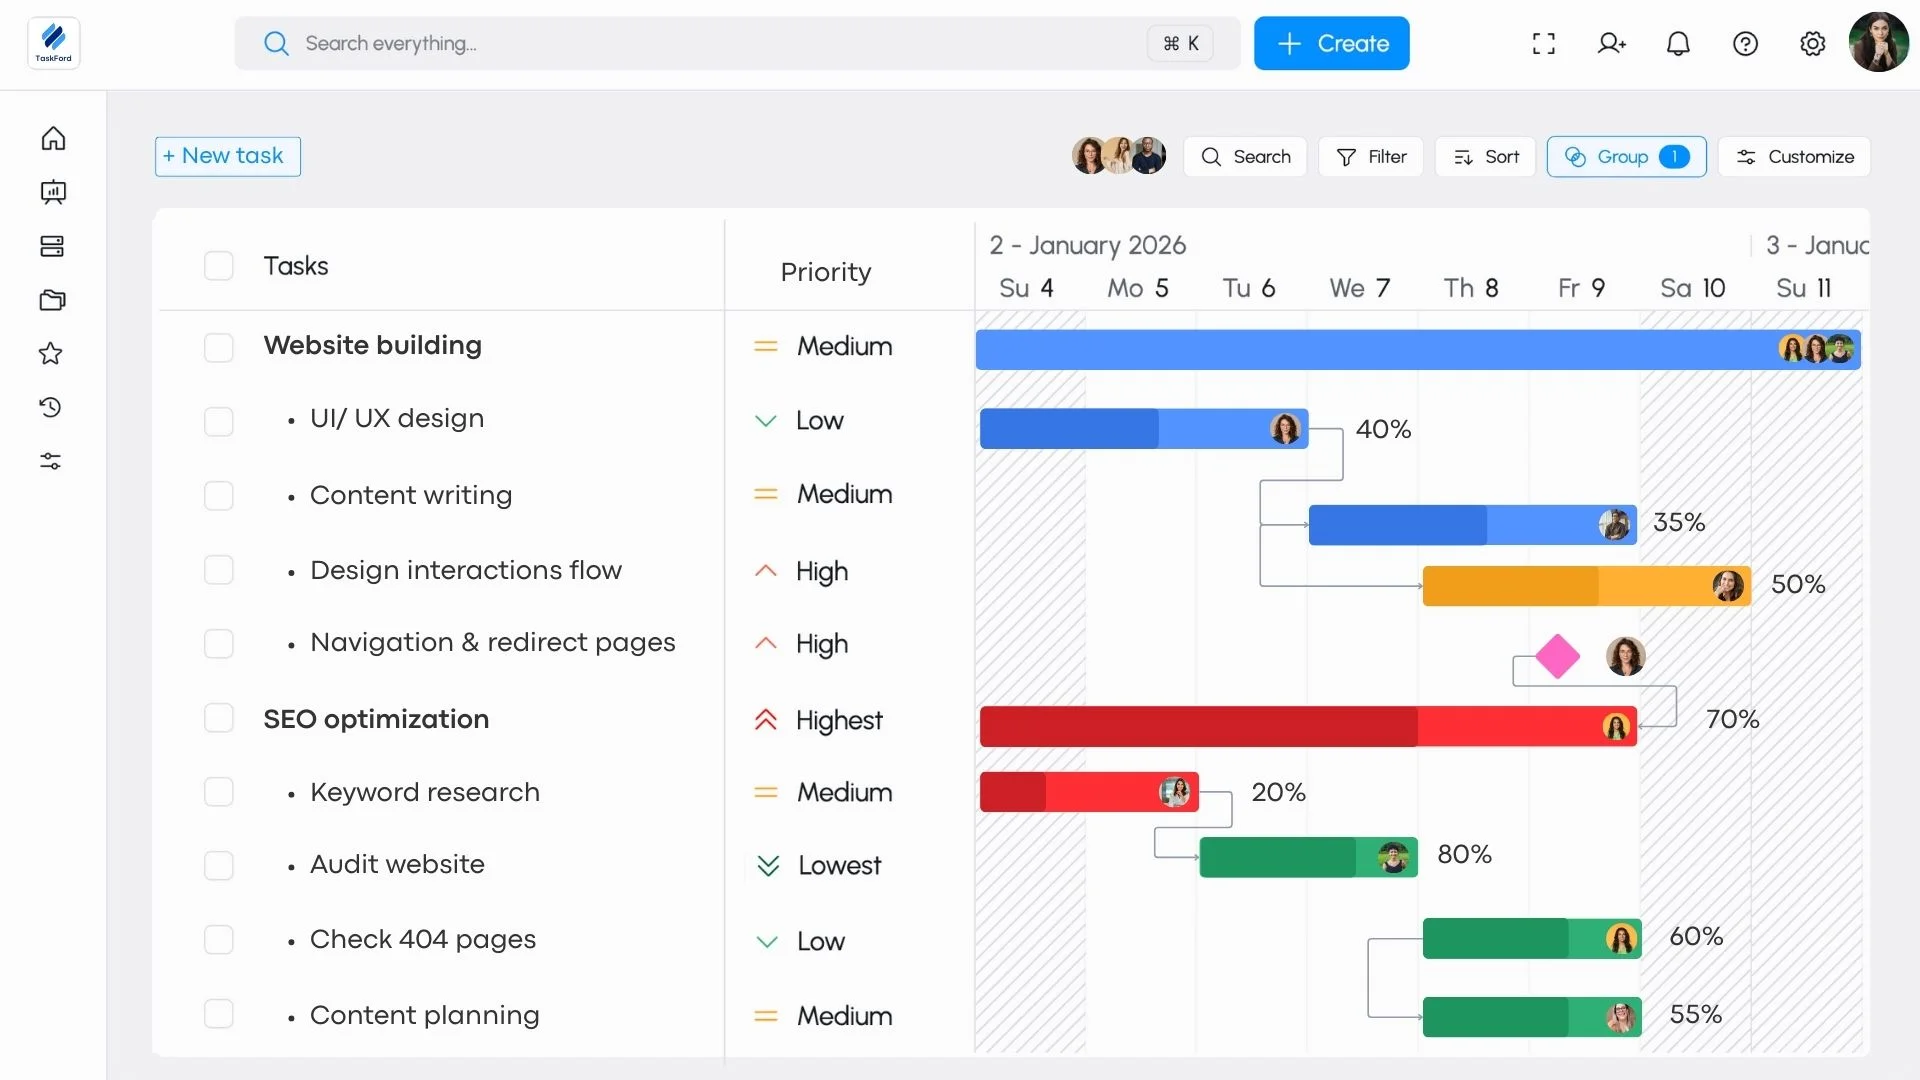
- Visualize Project Timelines: TaskFord’s Gantt charts offer a visual timeline of your project, displaying tasks and milestones on a clear gantt view. This gives teams an instant understanding of deadlines and key milestones.
- Manage Dependencies: With TaskFord’s Gantt charts, you can link tasks and set dependencies, ensuring that teams stay on schedule by showing which tasks need to be completed before others can begin. This helps prevent delays and keeps everything moving smoothly.
- Track Progress in Real-Time: TaskFord’s Gantt charts let you monitor tasks, spot potential blockers early, and ensure projects are delivered on time. Milestones are clearly tracked, and live updates reflect progress instantly, keeping everyone on the same page.
- Set Milestones and Deadlines: Setting clear milestones and deadlines within TaskFord’s Gantt chart helps teams focus on key deliverables. It ensures everyone is aligned and aware of what needs to be achieved and by when.
- Simplify Resource Allocation: TaskFord makes resource allocation easy by showing who is working on what. By visualizing team members and their tasks on the Gantt chart, project managers can balance workloads and avoid overburdening any one team member.
Conclusion
In summary, Gantt charts are powerful project management tools designed to simplify task organization and improve project visibility. By breaking down complex projects into smaller tasks and displaying progress in a visual timeline, Gantt charts make it easier to track progress, manage deadlines, and ensure project success.
Whether you’re planning a new project, allocating resources, or working in an agile environment, Gantt charts offer the clarity and structure needed to stay on track and keep all stakeholders aligned. Implement Gantt charts today to streamline your workflow and boost productivity across your team.
FAQ
What are the advantages of using a Gantt chart?
Gantt charts provide a clear visual overview of a project, making it easier to schedule tasks, track progress, manage dependencies, allocate resources, identify potential delays, and keep stakeholders aligned.
What are the disadvantages of a Gantt chart?
Gantt charts can become difficult to manage when projects contain hundreds or thousands of tasks. They may also require specialized software and can be time-consuming to update when project priorities or timelines change frequently.
What is the difference between a Gantt chart and a timeline?
A timeline provides a high-level view of events or milestones in chronological order, while a Gantt chart provides a more detailed project schedule. Gantt charts can show task durations, dependencies, assignments, progress, and relationships between tasks.
What is the difference between a Gantt chart and a Kanban board?
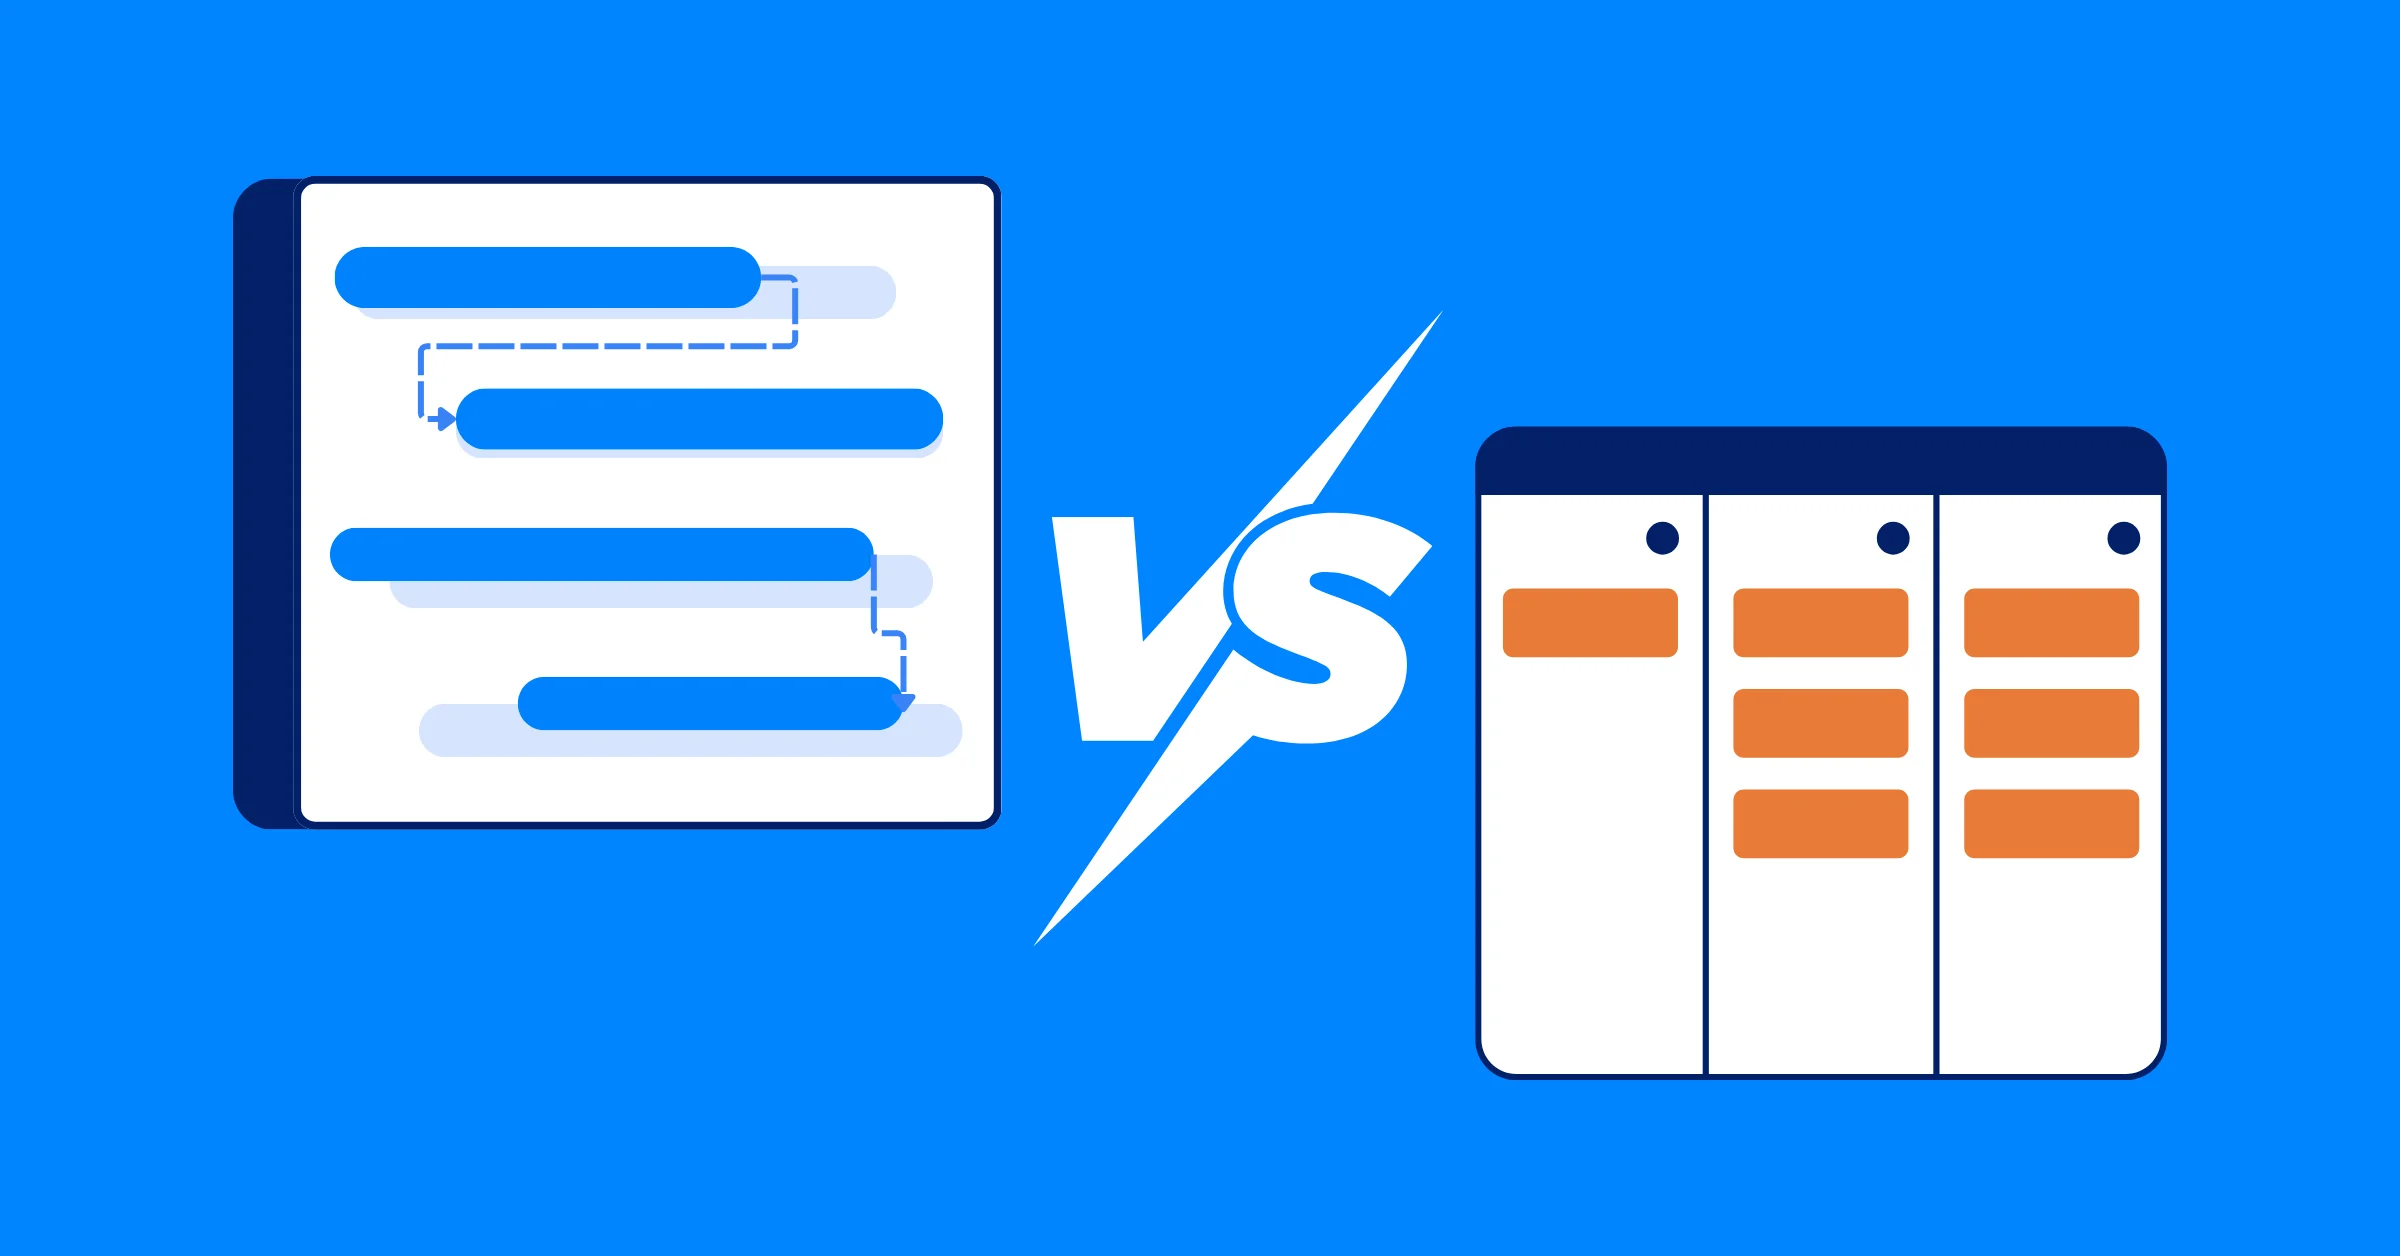
A Gantt chart focuses on project schedules, task durations, dependencies, and deadlines across a timeline. A Kanban board focuses on workflow and task status, typically organizing work into columns such as To Do, In Progress, and Done. Teams may use both tools for different aspects of project management.
Are Gantt charts only used for project management?
No. Gantt charts are commonly used in project management but can also support construction, software development, marketing, product development, engineering, and other work that requires task scheduling and timeline management.
Can Gantt charts be used for Agile projects?
Yes. Gantt charts can be used in Agile projects to visualize releases, milestones, dependencies, and longer-term timelines. However, teams with frequently changing priorities may need to update the chart regularly or combine it with more flexible Agile planning tools.
What is the difference between a Gantt chart and a project schedule?
A project schedule is the overall plan for when project activities should happen, while a Gantt chart is one way to visualize that schedule. A Gantt chart makes task durations, dependencies, milestones, and deadlines easier to understand at a glance.
Learn more
- Gantt Charts for Multiple Projects: Real-World Use Cases.
- Free Gantt Chart Software: Top 5 Tools for 2026.
- Work Breakdown Structure (WBS) Gantt Chart: A Complete Guide.
- Gantt Chart Dependencies: Explore the 4 Common Types.
Related Articles













How to Build and Manage a Product Roadmap with TaskFord












How to Build a Connected Project Timeline in TaskFord







What Are the Best Jira Alternatives for Scrum Teams?


















How WBS Reveals Delivery Breakdown Before It’s Too Late








![How To Conduct a Profound Stakeholder Analysis [+ Free Template]](/marketing/blog/stakeholder-analysis.webp)














What to Look for in Scrum Tools (Beyond Kanban Boards)

![Project Management Calendar for Teams and Managers [Free Templates]](/marketing/blog/project-management-calendar.webp)




How to Define Project Deliverables: A Step-by-Step Guide






![RACI Chart in Project Management: Rules & Examples [Free Download]](/marketing/blog/raci-chart.webp)













![7 Must-Have Project Management Documents Every PO Should Know [Free Templates]](/marketing/blog/project-management-documents.webp)






![How to Create a Winning Project Plan for IT Projects [10 Steps Included]](/marketing/blog/how-to-create-a-project-plan.webp)


![Daily Standup Best Practices: Apply AI to Organize Meetings Successfully [2026 Trends]](/marketing/blog/daily-standup.webp)





![How to Create a Project Communication Plan: Step-by-Step Guide [+Free Template]](/marketing/blog/project-communication-plan.png)


![Master Project Procurement Management in 5 Steps [Download a free plan template]](/marketing/blog/project-procurement-management.webp)

























Subscribe for Expert Tips
Unlock expert insights and stay ahead with TaskFord. Sign up now to receive valuable tips, strategies, and updates directly in your inbox.